Data
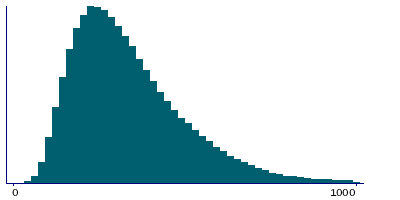
242,715 items of data are available, covering 176,871 participants.
Defined-instances run from 0 to 1, labelled using Instancing
178.
Units of measurement are deciseconds.
| Maximum | 9817 |
| Decile 9 | 580 |
| Decile 8 | 470 |
| Decile 7 | 400 |
| Decile 6 | 350 |
| Median | 310 |
| Decile 4 | 270 |
| Decile 3 | 236 |
| Decile 2 | 200 |
| Decile 1 | 160 |
| Minimum | 20 |
|

|
- There are 2366 distinct values.
- Mean = 357.229
- Std.dev = 266.205
- 3872 items above graph maximum of 1000
|
2 Instances
Instance 0 : Assessment run 2014
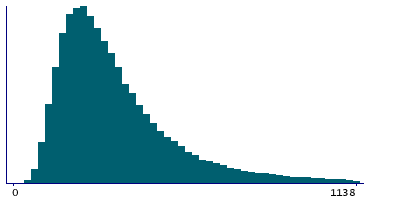
119,746 participants, 119,746 items
| Maximum | 9817 |
| Decile 9 | 645 |
| Decile 8 | 480 |
| Decile 7 | 396 |
| Decile 6 | 339 |
| Median | 295 |
| Decile 4 | 257 |
| Decile 3 | 223 |
| Decile 2 | 189 |
| Decile 1 | 152 |
| Minimum | 28 |
|

|
- There are 2364 distinct values.
- Mean = 373.496
- Std.dev = 348.517
- 2756 items above graph maximum of 1138
|
Instance 1 : Assessment run 2021
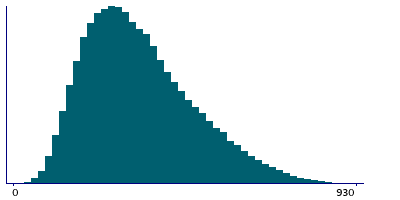
122,969 participants, 122,969 items
| Maximum | 940 |
| Decile 9 | 550 |
| Decile 8 | 460 |
| Decile 7 | 400 |
| Decile 6 | 360 |
| Median | 320 |
| Decile 4 | 280 |
| Decile 3 | 250 |
| Decile 2 | 210 |
| Decile 1 | 170 |
| Minimum | 20 |
|

|
- There are 91 distinct values.
- Mean = 341.389
- Std.dev = 145.204
- 1 item above graph maximum of 930
|
Notes
Indicates how long a participant viewed question FI5 before selecting their answer and clicking Next.
2 Related Data-Fields
| Field ID | Description | Relationship |
|---|
| 4980 | FI5 : duration viewed | Field 4980 is the touchscreen equivalent of web-based Current Field |
| 20173 | FI5 : family relationship calculation | Current Field is the duration spent viewing before entering the answer in Field 20173 |


