Data
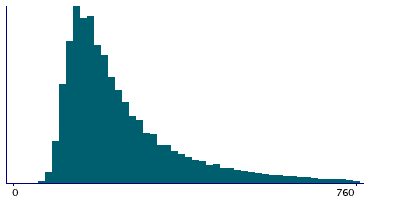
293,091 items of data are available, covering 205,335 participants.
Defined-instances run from 0 to 1, labelled using Instancing
178.
Units of measurement are deciseconds.
| Maximum | 9882 |
| Decile 9 | 440 |
| Decile 8 | 330 |
| Decile 7 | 270 |
| Decile 6 | 230 |
| Median | 200 |
| Decile 4 | 180 |
| Decile 3 | 160 |
| Decile 2 | 140 |
| Decile 1 | 120 |
| Minimum | 16 |
|

|
- There are 1695 distinct values.
- Mean = 250.501
- Std.dev = 187.619
- 3869 items above graph maximum of 760
|
2 Instances
Instance 0 : Assessment run 2014
122,339 participants, 122,339 items
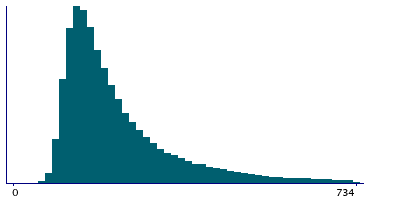
| Maximum | 9882 |
| Decile 9 | 425 |
| Decile 8 | 307 |
| Decile 7 | 249 |
| Decile 6 | 213 |
| Median | 187 |
| Decile 4 | 166 |
| Decile 3 | 149 |
| Decile 2 | 133 |
| Decile 1 | 116 |
| Minimum | 16 |
|

|
- There are 1692 distinct values.
- Mean = 245.897
- Std.dev = 240.442
- 3035 items above graph maximum of 734
|
Instance 1 : Assessment run 2021
170,752 participants, 170,752 items
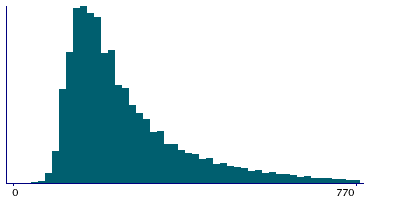
| Maximum | 1010 |
| Decile 9 | 450 |
| Decile 8 | 340 |
| Decile 7 | 280 |
| Decile 6 | 240 |
| Median | 210 |
| Decile 4 | 190 |
| Decile 3 | 170 |
| Decile 2 | 150 |
| Decile 1 | 130 |
| Minimum | 20 |
|

|
- There are 99 distinct values.
- Mean = 253.799
- Std.dev = 137.747
- 968 items above graph maximum of 770
|
Notes
Indicates how long a participant viewed question FI4 before selecting their answer and clicking Next.
2 Related Data-Fields
| Field ID | Description | Relationship |
|---|
| 4969 | FI4 : duration viewed | Field 4969 is the touchscreen equivalent of web-based Current Field |
| 20171 | FI4 : positional arithmetic | Current Field is the duration spent viewing before entering the answer in Field 20171 |


