Data
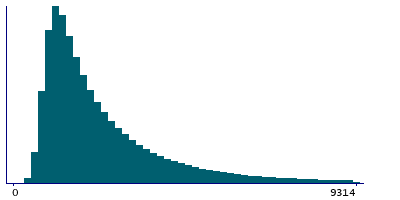
6,536,206 items of data are available, covering 190,213 participants.
Some values have special meanings defined by Data-Coding
485.
Defined-instances run from 0 to 1, labelled using Instancing
178.
Array indices run from 1 to 25.
Units of measurement are milliseconds.
| Maximum | 99880 |
| Decile 9 | 5128 |
| Decile 8 | 3564 |
| Decile 7 | 2774 |
| Decile 6 | 2256 |
| Median | 1879 |
| Decile 4 | 1588 |
| Decile 3 | 1352 |
| Decile 2 | 1149 |
| Decile 1 | 940 |
| Minimum | 1 |
|

|
- There are 32962 distinct values.
- Mean = 2698.17
- Std.dev = 2853.85
- 171007 items above graph maximum of 9316
- 445 items have value -1 (Invalid timing recorded)
|
2 Instances
Instance 0 : Assessment run 2014
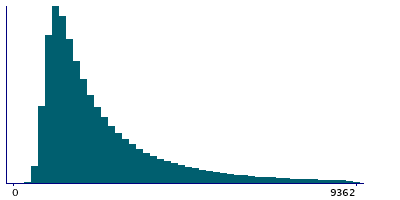
110,260 participants, 2,721,031 items
| Maximum | 99880 |
| Decile 9 | 5170 |
| Decile 8 | 3546 |
| Decile 7 | 2744 |
| Decile 6 | 2232 |
| Median | 1865 |
| Decile 4 | 1587 |
| Decile 3 | 1364 |
| Decile 2 | 1169 |
| Decile 1 | 976 |
| Minimum | 1 |
|

|
- There are 27978 distinct values.
- Mean = 2733.18
- Std.dev = 3144.85
- 72676 items above graph maximum of 9364
- 410 items have value -1 (Invalid timing recorded)
|
Instance 1 : Assessment run 2021
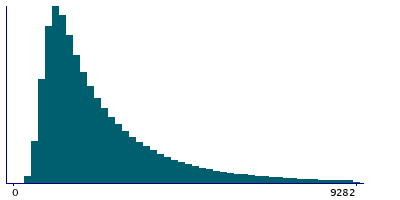
152,607 participants, 3,815,175 items
| Maximum | 95498 |
| Decile 9 | 5098 |
| Decile 8 | 3576 |
| Decile 7 | 2795 |
| Decile 6 | 2273 |
| Median | 1888 |
| Decile 4 | 1589 |
| Decile 3 | 1345 |
| Decile 2 | 1132 |
| Decile 1 | 912 |
| Minimum | 2 |
|

|
- There are 27349 distinct values.
- Mean = 2673.2
- Std.dev = 2626.44
- 98336 items above graph maximum of 9284
- 35 items have value -1 (Invalid timing recorded)
|
Notes
These timings were made using Javascript Date.getTime() running in a web-browser on the participants own equipment, and researchers should read
Resource 501 before making use of this data. Timings which have obviously been affected by the issues discussed have been flagged as Invalid.
Coding 485 defines 1 special value:
- -1 represents "Invalid timing recorded"


