Data
50,517 items of data are available, covering 49,721 participants.
Defined-instances run from 2 to 3, labelled using Instancing
2.
Units of measurement are seconds.
| Maximum | 1645 |
| Decile 9 | 154 |
| Decile 8 | 147 |
| Decile 7 | 141 |
| Decile 6 | 136 |
| Median | 131 |
| Decile 4 | 127 |
| Decile 3 | 123 |
| Decile 2 | 119 |
| Decile 1 | 106 |
| Minimum | 3 |
|
|
- There are 231 distinct values.
- Mean = 131.159
- Std.dev = 22.1177
- 157 items below graph minimum of 58
- 69 items above graph maximum of 202
|
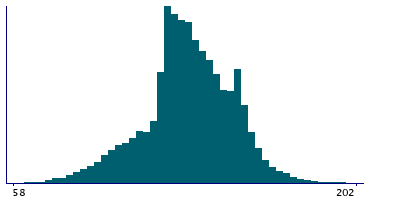
2 Instances
Instance 2 : Imaging visit (2014+)
35,669 participants, 35,669 items
| Maximum | 1645 |
| Decile 9 | 154 |
| Decile 8 | 148 |
| Decile 7 | 141 |
| Decile 6 | 136 |
| Median | 131 |
| Decile 4 | 127 |
| Decile 3 | 123 |
| Decile 2 | 119 |
| Decile 1 | 106 |
| Minimum | 3 |
|

|
- There are 222 distinct values.
- Mean = 131.337
- Std.dev = 22.9637
- 115 items below graph minimum of 58
- 54 items above graph maximum of 202
|
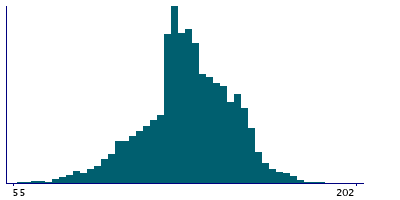
Instance 3 : First repeat imaging visit (2019+)
14,848 participants, 14,848 items
| Maximum | 276 |
| Decile 9 | 154 |
| Decile 8 | 147 |
| Decile 7 | 141 |
| Decile 6 | 136 |
| Median | 131 |
| Decile 4 | 127 |
| Decile 3 | 123 |
| Decile 2 | 118 |
| Decile 1 | 105 |
| Minimum | 3 |
|
|
- There are 166 distinct values.
- Mean = 130.732
- Std.dev = 19.9326
- 41 items below graph minimum of 56
- 14 items above graph maximum of 203
|
Notes
This is the interval between the participant ending the test due to reaching the incorrect-answer threshold or being timed-out.
0 Related Data-Fields
There are no related data-fields