Data
50,517 items of data are available, covering 49,721 participants.
Defined-instances run from 2 to 3, labelled using Instancing
2.
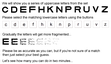
| Maximum | 45 |
| Decile 9 | 40 |
| Decile 8 | 35 |
| Decile 7 | 35 |
| Decile 6 | 35 |
| Median | 35 |
| Decile 4 | 34 |
| Decile 3 | 30 |
| Decile 2 | 30 |
| Decile 1 | 30 |
| Minimum | 1 |
|
|
- There are 36 distinct values.
- Mean = 33.3183
- Std.dev = 4.00359
- 195 items below graph minimum of 20
|
2 Instances
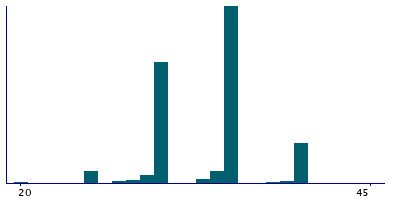
Instance 2 : Imaging visit (2014+)
35,669 participants, 35,669 items
| Maximum | 45 |
| Decile 9 | 40 |
| Decile 8 | 35 |
| Decile 7 | 35 |
| Decile 6 | 35 |
| Median | 35 |
| Decile 4 | 34 |
| Decile 3 | 30 |
| Decile 2 | 30 |
| Decile 1 | 30 |
| Minimum | 1 |
|
|
- There are 35 distinct values.
- Mean = 33.3064
- Std.dev = 4.0246
- 143 items below graph minimum of 20
|
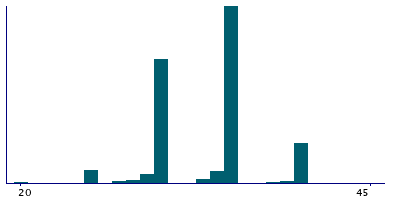
Instance 3 : First repeat imaging visit (2019+)
14,848 participants, 14,848 items
| Maximum | 45 |
| Decile 9 | 40 |
| Decile 8 | 35 |
| Decile 7 | 35 |
| Decile 6 | 35 |
| Median | 35 |
| Decile 4 | 34 |
| Decile 3 | 30 |
| Decile 2 | 30 |
| Decile 1 | 30 |
| Minimum | 4 |
|
|
- There are 27 distinct values.
- Mean = 33.3471
- Std.dev = 3.95251
- 52 items below graph minimum of 20
|
Notes
The number of letters displayed before the test was concluded. Usually this will be a multiple of five corresponding to the end of a round at a particular fragmentation level, however other values are possible if a time-out threshold is crossed during a round.
0 Related Data-Fields
There are no related data-fields