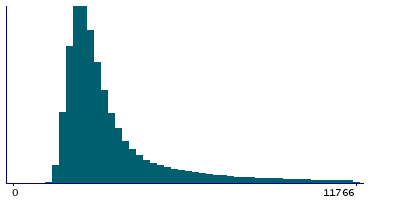
Data
1,683,143 items of data are available, covering 49,721 participants.
Defined-instances run from 2 to 3, labelled using Instancing
2.
Array indices run from 0 to 44.
Units of measurement are msec.
| Maximum | 1.64548e+06 |
| Decile 9 | 7016 |
| Decile 8 | 4531 |
| Decile 7 | 3579 |
| Decile 6 | 3109 |
| Median | 2797 |
| Decile 4 | 2563 |
| Decile 3 | 2359 |
| Decile 2 | 2157 |
| Decile 1 | 1938 |
| Minimum | 0 |
|
|
- There are 6878 distinct values.
- Mean = 3936.21
- Std.dev = 4058.13
- 59346 items above graph maximum of 12094
|
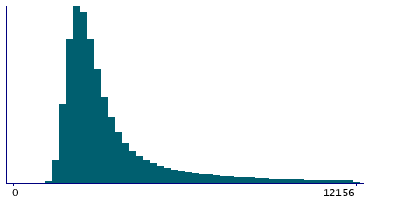
2 Instances
Instance 2 : Imaging visit (2014+)
35,669 participants, 1,188,005 items
| Maximum | 1.64548e+06 |
| Decile 9 | 7032 |
| Decile 8 | 4531 |
| Decile 7 | 3579 |
| Decile 6 | 3109 |
| Median | 2797 |
| Decile 4 | 2562 |
| Decile 3 | 2359 |
| Decile 2 | 2157 |
| Decile 1 | 1938 |
| Minimum | 0 |
|

|
- There are 6312 distinct values.
- Mean = 3942.85
- Std.dev = 4246.17
- 41835 items above graph maximum of 12126
|
Instance 3 : First repeat imaging visit (2019+)
14,848 participants, 495,138 items
| Maximum | 155469 |
| Decile 9 | 6984 |
| Decile 8 | 4515 |
| Decile 7 | 3579 |
| Decile 6 | 3109 |
| Median | 2797 |
| Decile 4 | 2563 |
| Decile 3 | 2359 |
| Decile 2 | 2171 |
| Decile 1 | 1938 |
| Minimum | 375 |
|
|
- There are 4996 distinct values.
- Mean = 3920.26
- Std.dev = 3566.69
- 17550 items above graph maximum of 12030
|
Notes
This is the time interval presenting an image and the participant pressing (after having made a selection) the Next button.
0 Related Data-Fields
There are no related data-fields