Data
15,926 items of data are available, covering 15,322 participants.
Defined-instances run from 2 to 3, labelled using Instancing
2.
Units of measurement are mm.
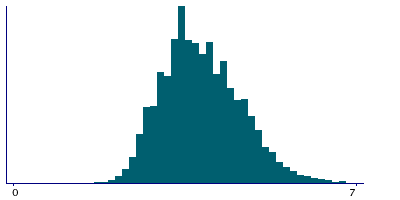
| Maximum | 9.2 |
| Decile 9 | 4.8 |
| Decile 8 | 4.3 |
| Decile 7 | 4 |
| Decile 6 | 3.8 |
| Median | 3.6 |
| Decile 4 | 3.4 |
| Decile 3 | 3.2 |
| Decile 2 | 3 |
| Decile 1 | 2.7 |
| Minimum | 1.7 |
|
|
- Mean = 3.66964
- Std.dev = 0.791257
- 8 items above graph maximum of 6.9
|
2 Instances
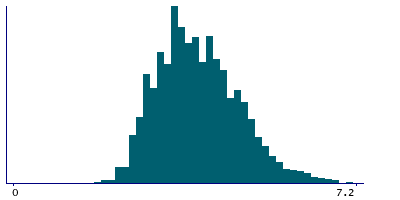
Instance 2 : Imaging visit (2014+)
3,287 participants, 3,287 items
| Maximum | 7.4 |
| Decile 9 | 4.9 |
| Decile 8 | 4.5 |
| Decile 7 | 4.2 |
| Decile 6 | 4 |
| Median | 3.7 |
| Decile 4 | 3.5 |
| Decile 3 | 3.3 |
| Decile 2 | 3.1 |
| Decile 1 | 2.8 |
| Minimum | 1.7 |
|
|
- Mean = 3.81661
- Std.dev = 0.84885
- 3 items above graph maximum of 7
|
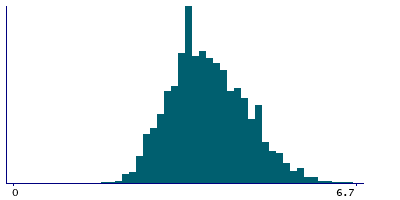
Instance 3 : First repeat imaging visit (2019+)
12,639 participants, 12,639 items
| Maximum | 9.2 |
| Decile 9 | 4.7 |
| Decile 8 | 4.3 |
| Decile 7 | 4 |
| Decile 6 | 3.8 |
| Median | 3.5 |
| Decile 4 | 3.4 |
| Decile 3 | 3.2 |
| Decile 2 | 2.9 |
| Decile 1 | 2.7 |
| Minimum | 1.7 |
|
|
- Mean = 3.63142
- Std.dev = 0.771002
- 5 items above graph maximum of 6.7
|
Notes
Pupil size (right)
0 Related Data-Fields
There are no related data-fields
0 Resources
There are no matching Resources
Problem running publication query
