Data
134,376 items of data are available, covering 12,941 participants.
Defined-instances run from 2 to 3, labelled using Instancing
2.
Array indices run from 1 to 10.
Units of measurement are mm.
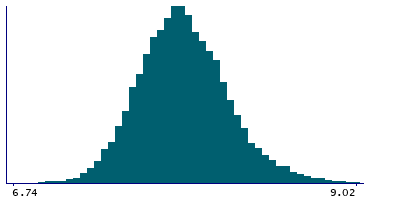
| Maximum | 13 |
| Decile 9 | 8.26 |
| Decile 8 | 8.12 |
| Decile 7 | 8.02 |
| Decile 6 | 7.94 |
| Median | 7.86 |
| Decile 4 | 7.79 |
| Decile 3 | 7.71 |
| Decile 2 | 7.63 |
| Decile 1 | 7.51 |
| Minimum | 5.65 |
|
|
- Mean = 7.87929
- Std.dev = 0.322233
- 210 items below graph minimum of 6.76
- 524 items above graph maximum of 9.01
|
2 Instances
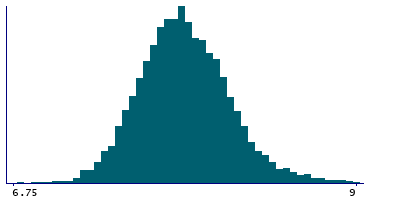
Instance 2 : Imaging visit (2014+)
3,220 participants, 31,732 items
| Maximum | 11.33 |
| Decile 9 | 8.25 |
| Decile 8 | 8.11 |
| Decile 7 | 8.02 |
| Decile 6 | 7.93 |
| Median | 7.86 |
| Decile 4 | 7.79 |
| Decile 3 | 7.71 |
| Decile 2 | 7.62 |
| Decile 1 | 7.51 |
| Minimum | 5.65 |
|
|
- Mean = 7.87565
- Std.dev = 0.3175
- 64 items below graph minimum of 6.77
- 127 items above graph maximum of 8.99
|
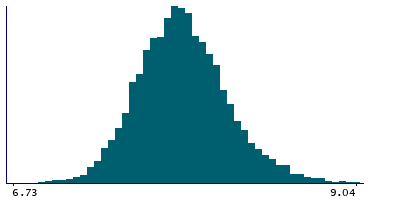
Instance 3 : First repeat imaging visit (2019+)
10,397 participants, 102,644 items
| Maximum | 13 |
| Decile 9 | 8.27 |
| Decile 8 | 8.12 |
| Decile 7 | 8.02 |
| Decile 6 | 7.94 |
| Median | 7.86 |
| Decile 4 | 7.79 |
| Decile 3 | 7.71 |
| Decile 2 | 7.63 |
| Decile 1 | 7.51 |
| Minimum | 5.75 |
|
|
- Mean = 7.88041
- Std.dev = 0.323674
- 144 items below graph minimum of 6.75
- 371 items above graph maximum of 9.03
|
Notes
Keratometry R1 radius (left)
0 Related Data-Fields
There are no related data-fields
0 Resources
There are no matching Resources
