Data
134,414 items of data are available, covering 12,955 participants.
Defined-instances run from 2 to 3, labelled using Instancing
2.
Array indices run from 1 to 10.
Units of measurement are mm.
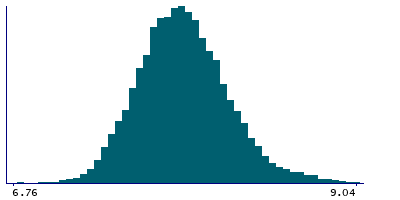
| Maximum | 11.41 |
| Decile 9 | 8.28 |
| Decile 8 | 8.14 |
| Decile 7 | 8.04 |
| Decile 6 | 7.95 |
| Median | 7.88 |
| Decile 4 | 7.81 |
| Decile 3 | 7.73 |
| Decile 2 | 7.65 |
| Decile 1 | 7.53 |
| Minimum | 5.57 |
|
|
- Mean = 7.89788
- Std.dev = 0.318869
- 161 items below graph minimum of 6.78
- 538 items above graph maximum of 9.03
|
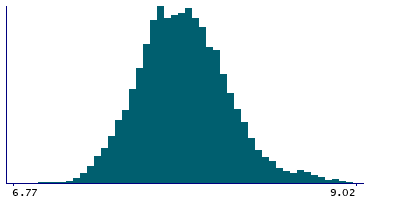
2 Instances
Instance 2 : Imaging visit (2014+)
3,211 participants, 31,560 items
| Maximum | 11.11 |
| Decile 9 | 8.28 |
| Decile 8 | 8.13 |
| Decile 7 | 8.03 |
| Decile 6 | 7.95 |
| Median | 7.88 |
| Decile 4 | 7.8 |
| Decile 3 | 7.72 |
| Decile 2 | 7.64 |
| Decile 1 | 7.52 |
| Minimum | 5.57 |
|
|
- Mean = 7.89347
- Std.dev = 0.318395
- 43 items below graph minimum of 6.76
- 116 items above graph maximum of 9.04
|
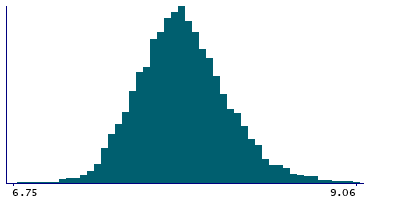
Instance 3 : First repeat imaging visit (2019+)
10,422 participants, 102,854 items
| Maximum | 11.41 |
| Decile 9 | 8.29 |
| Decile 8 | 8.14 |
| Decile 7 | 8.04 |
| Decile 6 | 7.95 |
| Median | 7.88 |
| Decile 4 | 7.81 |
| Decile 3 | 7.73 |
| Decile 2 | 7.65 |
| Decile 1 | 7.53 |
| Minimum | 5.6 |
|
|
- Mean = 7.89923
- Std.dev = 0.319002
- 104 items below graph minimum of 6.77
- 375 items above graph maximum of 9.05
|
Notes
Keratometry R1 radius (right)
0 Related Data-Fields
There are no related data-fields
0 Resources
There are no matching Resources
