Data
167,184 items of data are available, covering 16,162 participants.
Defined-instances run from 2 to 3, labelled using Instancing
2.
Array indices run from 1 to 10.
Units of measurement are dioptre.
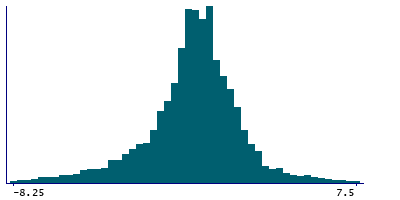
| Maximum | 11.75 |
| Decile 9 | 2.25 |
| Decile 8 | 1.5 |
| Decile 7 | 1 |
| Decile 6 | 0.5 |
| Median | 0.25 |
| Decile 4 | -0.25 |
| Decile 3 | -0.75 |
| Decile 2 | -1.5 |
| Decile 1 | -3 |
| Minimum | -21 |
|
|
- Mean = -0.0852489
- Std.dev = 2.42253
- 1292 items below graph minimum of -8.25
- 468 items above graph maximum of 7.5
|
2 Instances
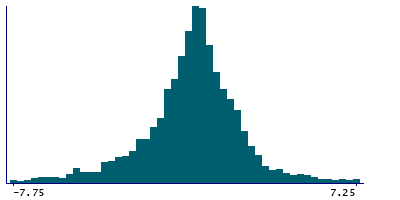
Instance 2 : Imaging visit (2014+)
3,507 participants, 34,837 items
| Maximum | 10.25 |
| Decile 9 | 2.25 |
| Decile 8 | 1.5 |
| Decile 7 | 1 |
| Decile 6 | 0.5 |
| Median | 0.25 |
| Decile 4 | -0.25 |
| Decile 3 | -0.75 |
| Decile 2 | -1.5 |
| Decile 1 | -2.75 |
| Minimum | -17 |
|
|
- Mean = -0.0343815
- Std.dev = 2.44655
- 389 items below graph minimum of -7.75
- 143 items above graph maximum of 7.25
|
Instance 3 : First repeat imaging visit (2019+)
13,336 participants, 132,347 items
| Maximum | 11.75 |
| Decile 9 | 2.25 |
| Decile 8 | 1.5 |
| Decile 7 | 1 |
| Decile 6 | 0.5 |
| Median | 0 |
| Decile 4 | -0.25 |
| Decile 3 | -0.75 |
| Decile 2 | -1.5 |
| Decile 1 | -3 |
| Minimum | -21 |
|

|
- Mean = -0.0986384
- Std.dev = 2.41599
- 988 items below graph minimum of -8.25
- 353 items above graph maximum of 7.5
|
Notes
Spherical equivalent value (right)
0 Related Data-Fields
There are no related data-fields
0 Resources
There are no matching Resources
