Data
167,175 items of data are available, covering 16,179 participants.
Defined-instances run from 2 to 3, labelled using Instancing
2.
Array indices run from 1 to 10.
Units of measurement are dioptre.
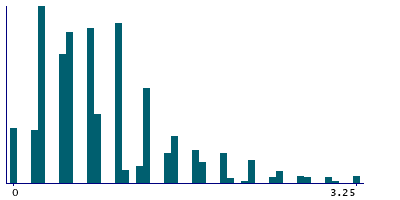
| Maximum | 9.75 |
| Decile 9 | 2 |
| Decile 8 | 1.5 |
| Decile 7 | 1 |
| Decile 6 | 1 |
| Median | 0.75 |
| Decile 4 | 0.5 |
| Decile 3 | 0.5 |
| Decile 2 | 0.25 |
| Decile 1 | 0.25 |
| Minimum | 0 |
|
|
- Mean = 0.957435
- Std.dev = 0.785709
- 1654 items above graph maximum of 3.75
|
2 Instances
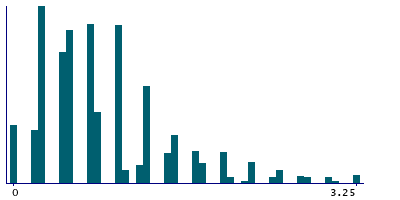
Instance 2 : Imaging visit (2014+)
3,512 participants, 34,872 items
| Maximum | 8 |
| Decile 9 | 1.75 |
| Decile 8 | 1.25 |
| Decile 7 | 1 |
| Decile 6 | 1 |
| Median | 0.75 |
| Decile 4 | 0.5 |
| Decile 3 | 0.5 |
| Decile 2 | 0.25 |
| Decile 1 | 0.25 |
| Minimum | 0 |
|
|
- Mean = 0.921434
- Std.dev = 0.760026
- 522 items above graph maximum of 3.25
|
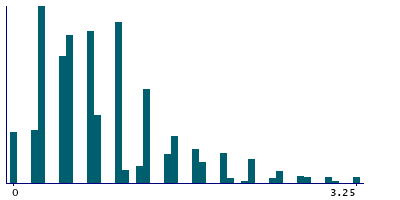
Instance 3 : First repeat imaging visit (2019+)
13,349 participants, 132,303 items
| Maximum | 9.75 |
| Decile 9 | 2 |
| Decile 8 | 1.5 |
| Decile 7 | 1.25 |
| Decile 6 | 1 |
| Median | 0.75 |
| Decile 4 | 0.75 |
| Decile 3 | 0.5 |
| Decile 2 | 0.5 |
| Decile 1 | 0.25 |
| Minimum | 0 |
|
|
- Mean = 0.966924
- Std.dev = 0.792068
- 1387 items above graph maximum of 3.75
|
Notes
Cylindrical power (left)
0 Related Data-Fields
There are no related data-fields
0 Resources
There are no matching Resources
