Data
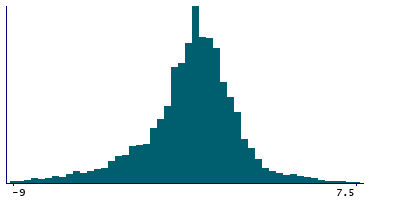
167,184 items of data are available, covering 16,162 participants.
Defined-instances run from 2 to 3, labelled using Instancing
2.
Array indices run from 1 to 10.
Units of measurement are dioptre.
| Maximum | 10.75 |
| Decile 9 | 2 |
| Decile 8 | 1 |
| Decile 7 | 0.5 |
| Decile 6 | 0.25 |
| Median | -0.25 |
| Decile 4 | -0.75 |
| Decile 3 | -1.25 |
| Decile 2 | -2 |
| Decile 1 | -3.5 |
| Minimum | -21.75 |
|
|
- Mean = -0.573832
- Std.dev = 2.49886
- 1374 items below graph minimum of -9
- 241 items above graph maximum of 7.5
|
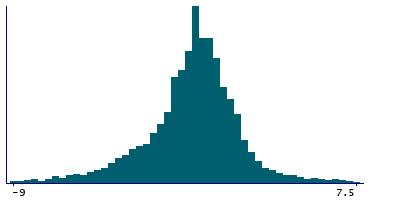
2 Instances
Instance 2 : Imaging visit (2014+)
3,507 participants, 34,837 items
| Maximum | 9.5 |
| Decile 9 | 2 |
| Decile 8 | 1.25 |
| Decile 7 | 0.5 |
| Decile 6 | 0.25 |
| Median | -0.25 |
| Decile 4 | -0.75 |
| Decile 3 | -1.25 |
| Decile 2 | -2 |
| Decile 1 | -3.5 |
| Minimum | -20.75 |
|
|
- Mean = -0.501859
- Std.dev = 2.51576
- 324 items below graph minimum of -9
- 56 items above graph maximum of 7.5
|
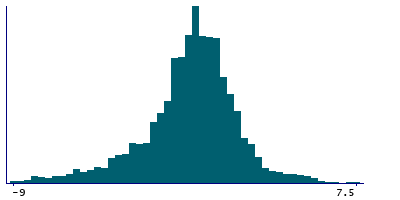
Instance 3 : First repeat imaging visit (2019+)
13,336 participants, 132,347 items
| Maximum | 10.75 |
| Decile 9 | 2 |
| Decile 8 | 1 |
| Decile 7 | 0.5 |
| Decile 6 | 0 |
| Median | -0.25 |
| Decile 4 | -0.75 |
| Decile 3 | -1.25 |
| Decile 2 | -2 |
| Decile 1 | -3.5 |
| Minimum | -21.75 |
|
|
- Mean = -0.592777
- Std.dev = 2.49405
- 1050 items below graph minimum of -9
- 185 items above graph maximum of 7.5
|
Notes
Spherical power (right)
0 Related Data-Fields
There are no related data-fields
0 Resources
There are no matching Resources
