Data
167,175 items of data are available, covering 16,179 participants.
Defined-instances run from 2 to 3, labelled using Instancing
2.
Array indices run from 1 to 10.
Units of measurement are dioptre.
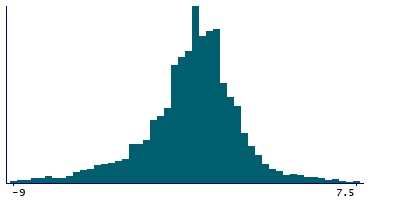
| Maximum | 11.75 |
| Decile 9 | 2 |
| Decile 8 | 1.25 |
| Decile 7 | 0.5 |
| Decile 6 | 0.25 |
| Median | -0.25 |
| Decile 4 | -0.75 |
| Decile 3 | -1.25 |
| Decile 2 | -2 |
| Decile 1 | -3.5 |
| Minimum | -19.75 |
|
|
- Mean = -0.54294
- Std.dev = 2.50914
- 1400 items below graph minimum of -9
- 247 items above graph maximum of 7.5
|
2 Instances
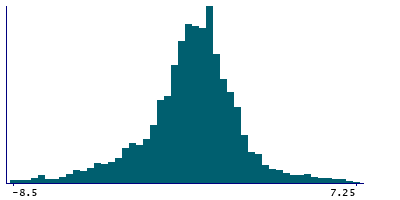
Instance 2 : Imaging visit (2014+)
3,512 participants, 34,872 items
| Maximum | 8.75 |
| Decile 9 | 2 |
| Decile 8 | 1.25 |
| Decile 7 | 0.75 |
| Decile 6 | 0.25 |
| Median | -0.25 |
| Decile 4 | -0.5 |
| Decile 3 | -1 |
| Decile 2 | -1.75 |
| Decile 1 | -3.25 |
| Minimum | -17.5 |
|
|
- Mean = -0.431249
- Std.dev = 2.48817
- 322 items below graph minimum of -8.5
- 78 items above graph maximum of 7.25
|
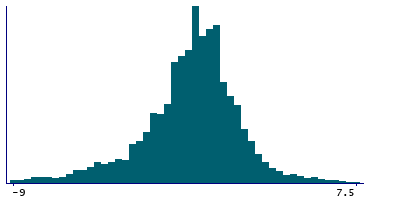
Instance 3 : First repeat imaging visit (2019+)
13,349 participants, 132,303 items
| Maximum | 11.75 |
| Decile 9 | 2 |
| Decile 8 | 1.25 |
| Decile 7 | 0.5 |
| Decile 6 | 0.25 |
| Median | -0.25 |
| Decile 4 | -0.75 |
| Decile 3 | -1.25 |
| Decile 2 | -2 |
| Decile 1 | -3.5 |
| Minimum | -19.75 |
|
|
- Mean = -0.572379
- Std.dev = 2.51381
- 1128 items below graph minimum of -9
- 200 items above graph maximum of 7.5
|
Notes
Spherical power (left)
0 Related Data-Fields
There are no related data-fields
0 Resources
There are no matching Resources
