Data
2,490,357 items of data are available, covering 87,923 participants.
Defined-instances run from 2 to 3, labelled using Instancing
2.
Array indices run from 0 to 24.
Units of measurement are milliseconds.
| Maximum | 9676 |
| Decile 9 | 44 |
| Decile 8 | 31 |
| Decile 7 | 24 |
| Decile 6 | 20 |
| Median | 16 |
| Decile 4 | 13 |
| Decile 3 | 11 |
| Decile 2 | 9 |
| Decile 1 | 7 |
| Minimum | 1 |
|
|
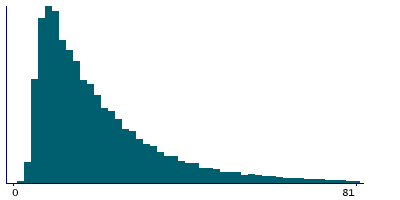
- There are 1523 distinct values.
- Mean = 24.1326
- Std.dev = 42.7623
- 62994 items above graph maximum of 81
|
2 Instances
Instance 2 : Imaging visit (2014+)
81,371 participants, 2,004,065 items
| Maximum | 9676 |
| Decile 9 | 44 |
| Decile 8 | 31 |
| Decile 7 | 24 |
| Decile 6 | 20 |
| Median | 16 |
| Decile 4 | 13 |
| Decile 3 | 11 |
| Decile 2 | 9 |
| Decile 1 | 7 |
| Minimum | 1 |
|

|
- There are 1433 distinct values.
- Mean = 24.1877
- Std.dev = 42.9249
- 51111 items above graph maximum of 81
|
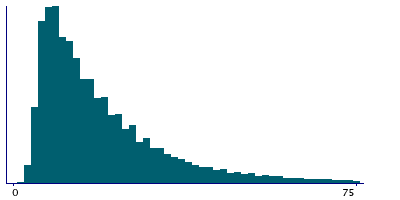
Instance 3 : First repeat imaging visit (2019+)
19,724 participants, 486,292 items
| Maximum | 4530 |
| Decile 9 | 44 |
| Decile 8 | 31 |
| Decile 7 | 24 |
| Decile 6 | 20 |
| Median | 16 |
| Decile 4 | 13 |
| Decile 3 | 11 |
| Decile 2 | 9 |
| Decile 1 | 7 |
| Minimum | 1 |
|
|
- There are 894 distinct values.
- Mean = 23.9055
- Std.dev = 42.0845
- 11883 items above graph maximum of 81
|
Notes
Interval between previous point and current one in alphanumeric path (trail #2). Note that these intervals are unlikely to sum to
Field 6350 due to rounding truncation.
If a participant did not complete the trail (as indicated by a zero in Field 6350) then the number of results for this field will be smaller than the length (25) of the trail.
1 Related Data-Field
| Field ID | Description | Relationship |
|---|
| 20155 | Interval between previous point and ... | Field 20155 is the online equivalent of Current Field |