Data
38,717 items of data are available, covering 29,968 participants.
Defined-instances run from 2 to 3, labelled using Instancing
2.
Array indices run from 0 to 23.
Units of measurement are error-count.
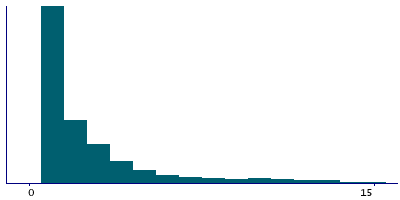
| Maximum | 143 |
| Decile 9 | 7 |
| Decile 8 | 4 |
| Decile 7 | 3 |
| Decile 6 | 2 |
| Median | 2 |
| Decile 4 | 1 |
| Decile 3 | 1 |
| Decile 2 | 1 |
| Decile 1 | 1 |
| Minimum | 1 |
|
|
- There are 41 distinct values.
- Mean = 3.14239
- Std.dev = 4.12151
- 1378 items above graph maximum of 13
|
2 Instances
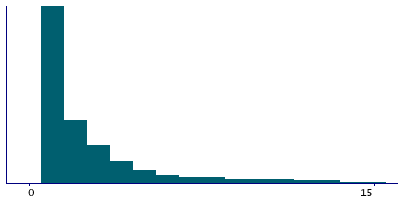
Instance 2 : Imaging visit (2014+)
25,446 participants, 31,340 items
| Maximum | 46 |
| Decile 9 | 7 |
| Decile 8 | 4 |
| Decile 7 | 3 |
| Decile 6 | 2 |
| Median | 2 |
| Decile 4 | 1 |
| Decile 3 | 1 |
| Decile 2 | 1 |
| Decile 1 | 1 |
| Minimum | 1 |
|
|
- There are 38 distinct values.
- Mean = 3.13826
- Std.dev = 4.06431
- 1131 items above graph maximum of 13
|
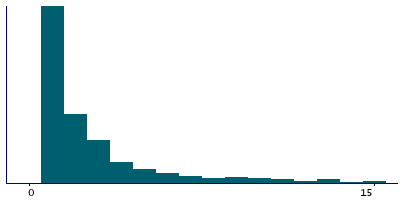
Instance 3 : First repeat imaging visit (2019+)
5,950 participants, 7,377 items
| Maximum | 143 |
| Decile 9 | 7 |
| Decile 8 | 4 |
| Decile 7 | 3 |
| Decile 6 | 2 |
| Median | 2 |
| Decile 4 | 1 |
| Decile 3 | 1 |
| Decile 2 | 1 |
| Decile 1 | 1 |
| Minimum | 1 |
|
|
- There are 35 distinct values.
- Mean = 3.15996
- Std.dev = 4.3561
- 247 items above graph maximum of 13
|
Notes
Errors before selecting a particular correct item in numeric path (trail #1). Only values greater than zero are recorded.
It is possible that the value recorded here is less than the sum of the values in Field 6349 since this field does not count mistakes made on the latest circle when the trail timed-out before it was correctly selected.