Data
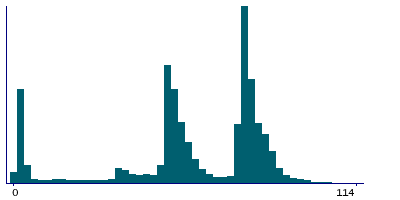
97,920 items of data are available, covering 95,036 participants.
Defined-instances run from 0 to 1, labelled using Instancing
2.
| Maximum | 114 |
| Decile 9 | 83 |
| Decile 8 | 79 |
| Decile 7 | 77 |
| Decile 6 | 76 |
| Median | 61 |
| Decile 4 | 55 |
| Decile 3 | 52 |
| Decile 2 | 49 |
| Decile 1 | 4 |
| Minimum | 1 |
|
|
- There are 112 distinct values.
- Mean = 58.7382
- Std.dev = 25.3664
|
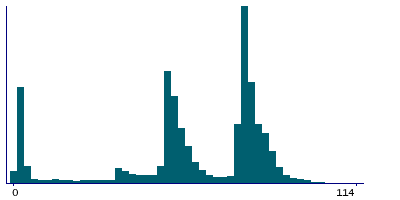
2 Instances
Instance 0 : Initial assessment visit (2006-2010) at which participants were recruited and consent given
77,857 participants, 77,857 items
| Maximum | 114 |
| Decile 9 | 83 |
| Decile 8 | 79 |
| Decile 7 | 77 |
| Decile 6 | 76 |
| Median | 62 |
| Decile 4 | 55 |
| Decile 3 | 52 |
| Decile 2 | 48 |
| Decile 1 | 3 |
| Minimum | 1 |
|
|
- There are 112 distinct values.
- Mean = 58.7552
- Std.dev = 25.779
|
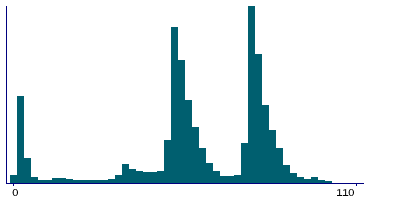
Instance 1 : First repeat assessment visit (2012-13)
20,063 participants, 20,063 items
| Maximum | 110 |
| Decile 9 | 82 |
| Decile 8 | 79 |
| Decile 7 | 77 |
| Decile 6 | 75 |
| Median | 58 |
| Decile 4 | 54 |
| Decile 3 | 52 |
| Decile 2 | 50 |
| Decile 1 | 15 |
| Minimum | 1 |
|
|
- There are 109 distinct values.
- Mean = 58.6725
- Std.dev = 23.6972
- 1 item above graph maximum of 110
|
Notes
Number of trend entries during exercise bike test
The Bike Test consists of three phases, a Pre- Test phase, where a resting ECG is recorded for some time. An Activity phase, where the participant cycles for a set period of time with increasing cycling workload, and finally a Recovery phase, where the participant has stopped pedalling and an ECG is recorded. At various points, called trends, during the test readings about heart rate, workload etc is recorded. This is the total number of trend entries.
0 Related Data-Fields
There are no related data-fields
1 Application
| Application ID | Title |
|---|
| 15031 | Genetic dissection of cardiovascular risk factors and their relation to disease to establish causality and identify novel targets of therapy |


