Data
131,237 items of data are available, covering 127,299 participants.
Defined-instances run from 0 to 1, labelled using Instancing
2.
| Maximum | 82.49 |
| Decile 9 | 13.13 |
| Decile 8 | 12.19 |
| Decile 7 | 11.57 |
| Decile 6 | 11.06 |
| Median | 10.58 |
| Decile 4 | 10.1 |
| Decile 3 | 9.6 |
| Decile 2 | 9.01 |
| Decile 1 | 8.16 |
| Minimum | 0 |
|

|
- Mean = 10.6535
- Std.dev = 2.51545
- 675 items above graph maximum of 18.1
|
2 Instances
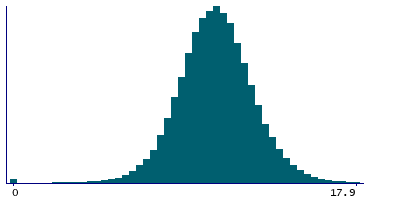
Instance 0 : Initial assessment visit (2006-2010) at which participants were recruited and consent given
111,801 participants, 111,801 items
| Maximum | 82.49 |
| Decile 9 | 13.03 |
| Decile 8 | 12.12 |
| Decile 7 | 11.52 |
| Decile 6 | 11.01 |
| Median | 10.55 |
| Decile 4 | 10.08 |
| Decile 3 | 9.59 |
| Decile 2 | 9.01 |
| Decile 1 | 8.16 |
| Minimum | 0 |
|
|
- Mean = 10.6141
- Std.dev = 2.49558
- 566 items above graph maximum of 17.9
|
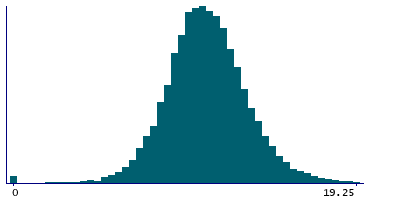
Instance 1 : First repeat assessment visit (2012-13)
19,436 participants, 19,436 items
| Maximum | 79.02 |
| Decile 9 | 13.7 |
| Decile 8 | 12.62 |
| Decile 7 | 11.9 |
| Decile 6 | 11.32 |
| Median | 10.77 |
| Decile 4 | 10.24 |
| Decile 3 | 9.71 |
| Decile 2 | 9.075 |
| Decile 1 | 8.15 |
| Minimum | 0 |
|
|
- Mean = 10.8802
- Std.dev = 2.61531
- 81 items above graph maximum of 19.25
|


