Data
136,153 items of data are available, covering 131,993 participants.
Defined-instances run from 0 to 1, labelled using Instancing
2.
Units of measurement are seconds.
| Maximum | 1928 |
| Decile 9 | 199 |
| Decile 8 | 166 |
| Decile 7 | 147 |
| Decile 6 | 134 |
| Median | 123 |
| Decile 4 | 113 |
| Decile 3 | 104 |
| Decile 2 | 94 |
| Decile 1 | 82 |
| Minimum | 5 |
|

|
- There are 596 distinct values.
- Mean = 134.621
- Std.dev = 55.1243
- 1690 items above graph maximum of 316
|
2 Instances
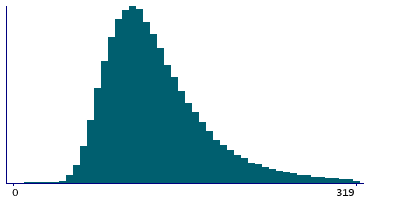
Instance 0 : Initial assessment visit (2006-2010) at which participants were recruited and consent given
116,172 participants, 116,172 items
| Maximum | 1928 |
| Decile 9 | 201 |
| Decile 8 | 168 |
| Decile 7 | 149 |
| Decile 6 | 135 |
| Median | 124 |
| Decile 4 | 114 |
| Decile 3 | 105 |
| Decile 2 | 95 |
| Decile 1 | 83 |
| Minimum | 5 |
|
|
- There are 584 distinct values.
- Mean = 135.907
- Std.dev = 55.5562
- 1415 items above graph maximum of 319
|
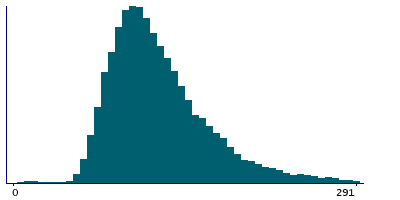
Instance 1 : First repeat assessment visit (2012-13)
19,981 participants, 19,981 items
| Maximum | 1193 |
| Decile 9 | 185 |
| Decile 8 | 156 |
| Decile 7 | 139 |
| Decile 6 | 126 |
| Median | 116 |
| Decile 4 | 107 |
| Decile 3 | 99 |
| Decile 2 | 90 |
| Decile 1 | 79 |
| Minimum | 6 |
|
|
- There are 417 distinct values.
- Mean = 127.148
- Std.dev = 51.9164
- 301 items above graph maximum of 291
|


