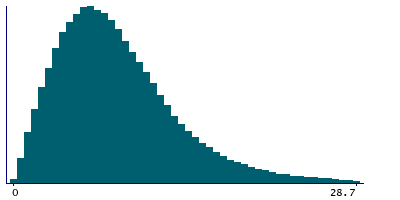
Data
356,309 items of data are available, covering 121,793 participants.
Defined-instances run from 0 to 1, labelled using Instancing
2.
Array indices run from 0 to 5.
| Maximum | 271.8 |
| Decile 9 | 15.9 |
| Decile 8 | 12.6 |
| Decile 7 | 10.6 |
| Decile 6 | 9.1 |
| Median | 7.9 |
| Decile 4 | 6.8 |
| Decile 3 | 5.6 |
| Decile 2 | 4.5 |
| Decile 1 | 3.1 |
| Minimum | 0 |
|
|
- Mean = 9.19981
- Std.dev = 7.31557
- 5197 items above graph maximum of 28.7
|
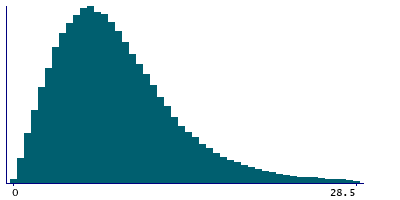
2 Instances
Instance 0 : Initial assessment visit (2006-2010) at which participants were recruited and consent given
107,558 participants, 305,839 items
| Maximum | 271.8 |
| Decile 9 | 15.8 |
| Decile 8 | 12.5 |
| Decile 7 | 10.5 |
| Decile 6 | 9.1 |
| Median | 7.8 |
| Decile 4 | 6.7 |
| Decile 3 | 5.6 |
| Decile 2 | 4.4 |
| Decile 1 | 3.1 |
| Minimum | 0 |
|
|
- Mean = 9.13409
- Std.dev = 7.38409
- 4587 items above graph maximum of 28.5
|
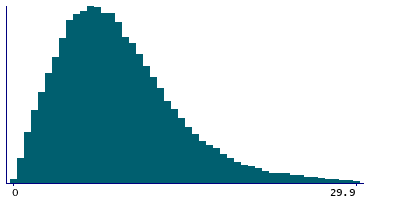
Instance 1 : First repeat assessment visit (2012-13)
17,907 participants, 50,470 items
| Maximum | 174.1 |
| Decile 9 | 16.6 |
| Decile 8 | 13.2 |
| Decile 7 | 11.2 |
| Decile 6 | 9.7 |
| Median | 8.4 |
| Decile 4 | 7.2 |
| Decile 3 | 6 |
| Decile 2 | 4.8 |
| Decile 1 | 3.3 |
| Minimum | 0 |
|
|
- Mean = 9.59807
- Std.dev = 6.87237
- 621 items above graph maximum of 29.9
|
Notes
This is the asymmetry index as part of the keratometry result taken at 3mm for the right eye
1 Related Data-Field
| Field ID | Description | Relationship |
|---|
| 5156 | 3mm asymmetry index (left) | Field 5156 is the opposite-side complement to Current Field |


