Data
375,742 items of data are available, covering 124,406 participants.
Defined-instances run from 0 to 1, labelled using Instancing
2.
Array indices run from 0 to 5.
Units of measurement are diopters.
| Maximum | 59.31 |
| Decile 9 | 45 |
| Decile 8 | 44.35 |
| Decile 7 | 43.89 |
| Decile 6 | 43.49 |
| Median | 43.16 |
| Decile 4 | 42.78 |
| Decile 3 | 42.35 |
| Decile 2 | 41.93 |
| Decile 1 | 41.26 |
| Minimum | 30.52 |
|

|
- Mean = 43.1239
- Std.dev = 1.525
- 590 items below graph minimum of 37.52
- 148 items above graph maximum of 48.74
|
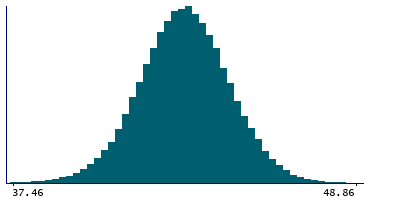
2 Instances
Instance 0 : Initial assessment visit (2006-2010) at which participants were recruited and consent given
109,829 participants, 322,010 items
| Maximum | 59.31 |
| Decile 9 | 45.06 |
| Decile 8 | 44.35 |
| Decile 7 | 43.89 |
| Decile 6 | 43.49 |
| Median | 43.16 |
| Decile 4 | 42.78 |
| Decile 3 | 42.4 |
| Decile 2 | 41.93 |
| Decile 1 | 41.26 |
| Minimum | 30.52 |
|
|
- Mean = 43.1273
- Std.dev = 1.52816
- 480 items below graph minimum of 37.46
- 122 items above graph maximum of 48.86
|
Instance 1 : First repeat assessment visit (2012-13)
18,388 participants, 53,732 items
| Maximum | 52.24 |
| Decile 9 | 45 |
| Decile 8 | 44.35 |
| Decile 7 | 43.89 |
| Decile 6 | 43.49 |
| Median | 43.1 |
| Decile 4 | 42.72 |
| Decile 3 | 42.35 |
| Decile 2 | 41.87 |
| Decile 1 | 41.21 |
| Minimum | 30.91 |
|

|
- Mean = 43.1034
- Std.dev = 1.50576
- 53 items below graph minimum of 37.42
- 11 items above graph maximum of 48.79
|
Notes
This is the weak meridian of keratometry results taken at 3mm for the left eye
1 Related Data-Field
| Field ID | Description | Relationship |
|---|
| 5099 | 3mm weak meridian (right) | Current Field is the opposite-side complement to Field 5099 |


