Data
398,674 items of data are available, covering 129,121 participants.
Defined-instances run from 0 to 1, labelled using Instancing
2.
Array indices run from 0 to 9.
Units of measurement are diopters.
| Maximum | 10.73 |
| Decile 9 | 1.73 |
| Decile 8 | 1.26 |
| Decile 7 | 1.01 |
| Decile 6 | 0.83 |
| Median | 0.69 |
| Decile 4 | 0.57 |
| Decile 3 | 0.47 |
| Decile 2 | 0.36 |
| Decile 1 | 0.24 |
| Minimum | 0 |
|
|
- Mean = 0.884831
- Std.dev = 0.741245
- 6677 items above graph maximum of 3.22
|
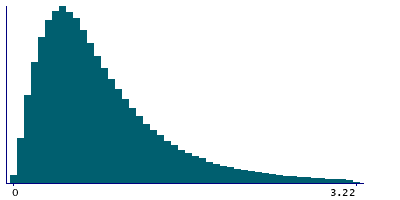
2 Instances
Instance 0 : Initial assessment visit (2006-2010) at which participants were recruited and consent given
113,731 participants, 341,100 items
| Maximum | 10.71 |
| Decile 9 | 1.7 |
| Decile 8 | 1.24 |
| Decile 7 | 0.99 |
| Decile 6 | 0.82 |
| Median | 0.68 |
| Decile 4 | 0.56 |
| Decile 3 | 0.46 |
| Decile 2 | 0.35 |
| Decile 1 | 0.24 |
| Minimum | 0 |
|

|
- Mean = 0.873555
- Std.dev = 0.738285
- 5989 items above graph maximum of 3.16
|
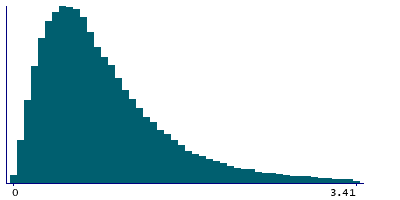
Instance 1 : First repeat assessment visit (2012-13)
19,358 participants, 57,574 items
| Maximum | 10.73 |
| Decile 9 | 1.84 |
| Decile 8 | 1.36 |
| Decile 7 | 1.1 |
| Decile 6 | 0.91 |
| Median | 0.76 |
| Decile 4 | 0.63 |
| Decile 3 | 0.52 |
| Decile 2 | 0.4 |
| Decile 1 | 0.27 |
| Minimum | 0 |
|
|
- Mean = 0.951631
- Std.dev = 0.755102
- 827 items above graph maximum of 3.41
|
Notes
This is the cylindrical power of refractometry results for the left eye (0.00 indicates none)
1 Related Data-Field
| Field ID | Description | Relationship |
|---|
| 5087 | Cylindrical power (right) | Current Field is the opposite-side complement to Field 5087 |


