Data
398,674 items of data are available, covering 129,121 participants.
Defined-instances run from 0 to 1, labelled using Instancing
2.
Array indices run from 0 to 9.
Units of measurement are diopters.
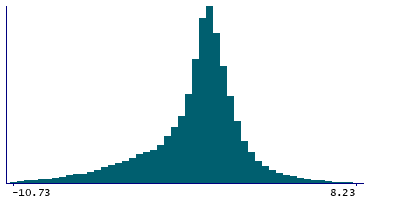
| Maximum | 20.46 |
| Decile 9 | 1.91 |
| Decile 8 | 1.05 |
| Decile 7 | 0.53 |
| Decile 6 | 0.15 |
| Median | -0.2 |
| Decile 4 | -0.62 |
| Decile 3 | -1.26 |
| Decile 2 | -2.37 |
| Decile 1 | -4.41 |
| Minimum | -25.74 |
|
|
- Mean = -0.746357
- Std.dev = 2.85931
- 3058 items below graph minimum of -10.73
- 388 items above graph maximum of 8.23
|
2 Instances
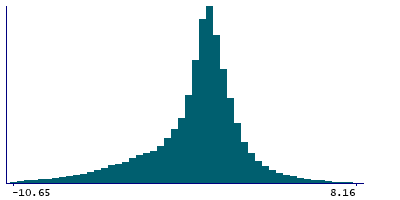
Instance 0 : Initial assessment visit (2006-2010) at which participants were recruited and consent given
113,731 participants, 341,100 items
| Maximum | 20.46 |
| Decile 9 | 1.89 |
| Decile 8 | 1.03 |
| Decile 7 | 0.52 |
| Decile 6 | 0.14 |
| Median | -0.2 |
| Decile 4 | -0.6 |
| Decile 3 | -1.23 |
| Decile 2 | -2.34 |
| Decile 1 | -4.37 |
| Minimum | -25.74 |
|
|
- Mean = -0.740818
- Std.dev = 2.83939
- 2708 items below graph minimum of -10.63
- 370 items above graph maximum of 8.15
|
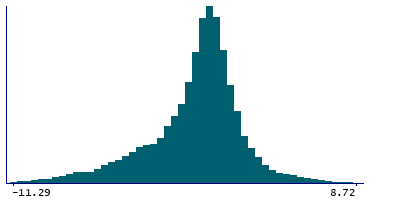
Instance 1 : First repeat assessment visit (2012-13)
19,358 participants, 57,574 items
| Maximum | 11.01 |
| Decile 9 | 2.05 |
| Decile 8 | 1.16 |
| Decile 7 | 0.63 |
| Decile 6 | 0.2 |
| Median | -0.22 |
| Decile 4 | -0.71 |
| Decile 3 | -1.45 |
| Decile 2 | -2.62 |
| Decile 1 | -4.62 |
| Minimum | -25.64 |
|
|
- Mean = -0.779177
- Std.dev = 2.97441
- 415 items below graph minimum of -11.29
- 43 items above graph maximum of 8.72
|
Notes
This is the spherical power of refractometry results for the left eye (0.00 indicates none)
1 Related Data-Field
| Field ID | Description | Relationship |
|---|
| 5084 | Spherical power (right) | Current Field is the opposite-side complement to Field 5084 |


