Data
197,102 items of data are available, covering 159,009 participants.
Defined-instances run from 0 to 3, labelled using Instancing
2.
| Maximum | 126008 |
| Decile 9 | 631 |
| Decile 8 | 500 |
| Decile 7 | 423 |
| Decile 6 | 367 |
| Median | 324 |
| Decile 4 | 285 |
| Decile 3 | 249 |
| Decile 2 | 212 |
| Decile 1 | 163 |
| Minimum | 3 |
|
|
- There are 1753 distinct values.
- Mean = 370.491
- Std.dev = 440.516
- 1947 items above graph maximum of 1099
|
4 Instances
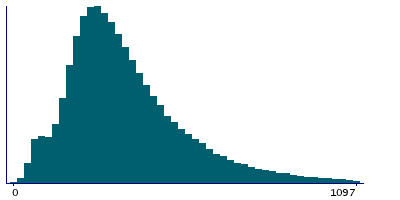
Instance 0 : Initial assessment visit (2006-2010) at which participants were recruited and consent given
103,144 participants, 103,144 items
| Maximum | 3064 |
| Decile 9 | 626 |
| Decile 8 | 497 |
| Decile 7 | 420 |
| Decile 6 | 365 |
| Median | 321 |
| Decile 4 | 283 |
| Decile 3 | 247 |
| Decile 2 | 209 |
| Decile 1 | 155 |
| Minimum | 3 |
|

|
- There are 1559 distinct values.
- Mean = 365.032
- Std.dev = 211.289
- 967 items above graph maximum of 1097
|
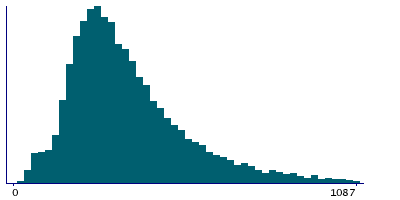
Instance 1 : First repeat assessment visit (2012-13)
13,929 participants, 13,929 items
| Maximum | 3065 |
| Decile 9 | 630 |
| Decile 8 | 496 |
| Decile 7 | 420 |
| Decile 6 | 366 |
| Median | 322 |
| Decile 4 | 285 |
| Decile 3 | 251 |
| Decile 2 | 216 |
| Decile 1 | 173 |
| Minimum | 12 |
|
|
- There are 1110 distinct values.
- Mean = 370.607
- Std.dev = 208.911
- 143 items above graph maximum of 1087
|
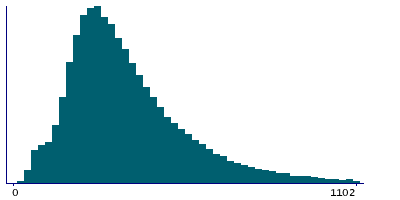
Instance 2 : Imaging visit (2014+)
65,621 participants, 65,621 items
| Maximum | 116926 |
| Decile 9 | 637 |
| Decile 8 | 506 |
| Decile 7 | 427 |
| Decile 6 | 371 |
| Median | 327 |
| Decile 4 | 288 |
| Decile 3 | 252 |
| Decile 2 | 216 |
| Decile 1 | 170 |
| Minimum | 5 |
|
|
- There are 1489 distinct values.
- Mean = 376.583
- Std.dev = 503.116
- 698 items above graph maximum of 1104
|
Instance 3 : First repeat imaging visit (2019+)
14,408 participants, 14,408 items
| Maximum | 126008 |
| Decile 9 | 637 |
| Decile 8 | 505 |
| Decile 7 | 426 |
| Decile 6 | 370 |
| Median | 325 |
| Decile 4 | 286 |
| Decile 3 | 251 |
| Decile 2 | 217 |
| Decile 1 | 171 |
| Minimum | 7 |
|

|
- There are 1124 distinct values.
- Mean = 381.719
- Std.dev = 1067.48
- 142 items above graph maximum of 1103
|

