Data
216,365 items of data are available, covering 173,887 participants.
Defined-instances run from 0 to 3, labelled using Instancing
2.
| Maximum | 101655 |
| Decile 9 | 113 |
| Decile 8 | 92 |
| Decile 7 | 80 |
| Decile 6 | 71 |
| Median | 65 |
| Decile 4 | 59 |
| Decile 3 | 54 |
| Decile 2 | 49 |
| Decile 1 | 43 |
| Minimum | 4 |
|

|
- There are 444 distinct values.
- Mean = 74.1581
- Std.dev = 276.417
- 2876 items above graph maximum of 183
|
4 Instances
Instance 0 : Initial assessment visit (2006-2010) at which participants were recruited and consent given
114,276 participants, 114,276 items
| Maximum | 4127 |
| Decile 9 | 118 |
| Decile 8 | 95 |
| Decile 7 | 82 |
| Decile 6 | 73 |
| Median | 66 |
| Decile 4 | 60 |
| Decile 3 | 54 |
| Decile 2 | 49 |
| Decile 1 | 43 |
| Minimum | 5 |
|

|
- There are 415 distinct values.
- Mean = 75.2675
- Std.dev = 39.9988
- 1530 items above graph maximum of 193
|
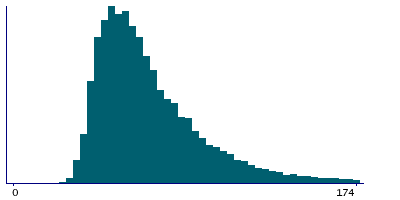
Instance 1 : First repeat assessment visit (2012-13)
15,188 participants, 15,188 items
| Maximum | 407 |
| Decile 9 | 108 |
| Decile 8 | 89 |
| Decile 7 | 77 |
| Decile 6 | 69 |
| Median | 63 |
| Decile 4 | 57 |
| Decile 3 | 52 |
| Decile 2 | 48 |
| Decile 1 | 42 |
| Minimum | 14 |
|
|
- There are 243 distinct values.
- Mean = 70.7279
- Std.dev = 31.0684
- 194 items above graph maximum of 174
|
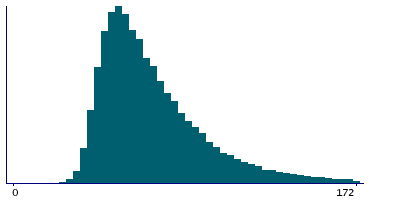
Instance 2 : Imaging visit (2014+)
71,330 participants, 71,330 items
| Maximum | 101655 |
| Decile 9 | 108 |
| Decile 8 | 89 |
| Decile 7 | 78 |
| Decile 6 | 70 |
| Median | 64 |
| Decile 4 | 58 |
| Decile 3 | 53 |
| Decile 2 | 49 |
| Decile 1 | 44 |
| Minimum | 4 |
|
|
- There are 317 distinct values.
- Mean = 73.9959
- Std.dev = 478.331
- 886 items above graph maximum of 172
|
Instance 3 : First repeat imaging visit (2019+)
15,571 participants, 15,571 items
| Maximum | 612 |
| Decile 9 | 105 |
| Decile 8 | 87 |
| Decile 7 | 76 |
| Decile 6 | 69 |
| Median | 63 |
| Decile 4 | 58 |
| Decile 3 | 53 |
| Decile 2 | 49 |
| Decile 1 | 44 |
| Minimum | 8 |
|

|
- There are 227 distinct values.
- Mean = 70.1051
- Std.dev = 29.1596
- 181 items above graph maximum of 166
|

