Data
297,369 items of data are available, covering 235,482 participants.
Defined-instances run from 0 to 3, labelled using Instancing
2.
| Maximum | 87085 |
| Decile 9 | 411 |
| Decile 8 | 302 |
| Decile 7 | 246 |
| Decile 6 | 208 |
| Median | 181 |
| Decile 4 | 159 |
| Decile 3 | 141 |
| Decile 2 | 124 |
| Decile 1 | 106 |
| Minimum | 7 |
|
|
- There are 1793 distinct values.
- Mean = 232.407
- Std.dev = 318.293
- 6065 items above graph maximum of 716
|
4 Instances
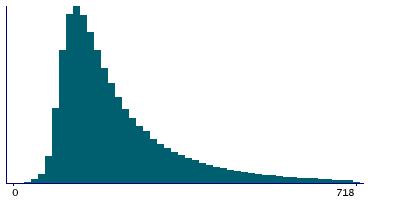
Instance 0 : Initial assessment visit (2006-2010) at which participants were recruited and consent given
164,470 participants, 164,470 items
| Maximum | 7721 |
| Decile 9 | 438 |
| Decile 8 | 319 |
| Decile 7 | 258 |
| Decile 6 | 216 |
| Median | 187 |
| Decile 4 | 163 |
| Decile 3 | 144 |
| Decile 2 | 126 |
| Decile 1 | 106 |
| Minimum | 7 |
|
|
- There are 1677 distinct values.
- Mean = 242.515
- Std.dev = 188.355
- 3386 items above graph maximum of 770
|
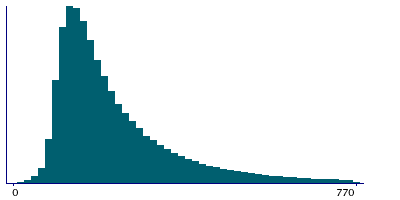
Instance 1 : First repeat assessment visit (2012-13)
20,018 participants, 20,018 items
| Maximum | 3267 |
| Decile 9 | 369 |
| Decile 8 | 275 |
| Decile 7 | 225 |
| Decile 6 | 193 |
| Median | 170 |
| Decile 4 | 152 |
| Decile 3 | 136 |
| Decile 2 | 120 |
| Decile 1 | 104 |
| Minimum | 29 |
|

|
- There are 856 distinct values.
- Mean = 213.194
- Std.dev = 145.268
- 398 items above graph maximum of 634
|
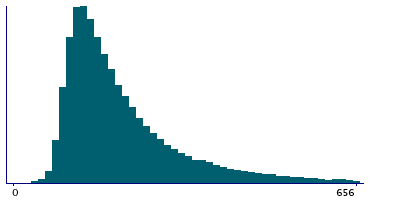
Instance 2 : Imaging visit (2014+)
93,193 participants, 93,193 items
| Maximum | 87085 |
| Decile 9 | 381 |
| Decile 8 | 284 |
| Decile 7 | 234 |
| Decile 6 | 200 |
| Median | 175 |
| Decile 4 | 156 |
| Decile 3 | 138 |
| Decile 2 | 123 |
| Decile 1 | 106 |
| Minimum | 9 |
|
|
- There are 1233 distinct values.
- Mean = 222.273
- Std.dev = 501.475
- 1733 items above graph maximum of 656
|
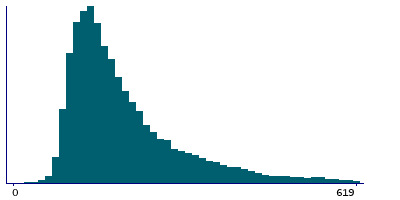
Instance 3 : First repeat imaging visit (2019+)
19,688 participants, 19,688 items
| Maximum | 3207 |
| Decile 9 | 371.5 |
| Decile 8 | 279 |
| Decile 7 | 230 |
| Decile 6 | 198 |
| Median | 174 |
| Decile 4 | 155 |
| Decile 3 | 139 |
| Decile 2 | 123 |
| Decile 1 | 106 |
| Minimum | 23 |
|
|
- There are 849 distinct values.
- Mean = 215.47
- Std.dev = 141.44
- 355 items above graph maximum of 637
|

