Data
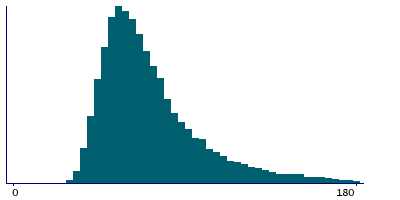
297,867 items of data are available, covering 235,872 participants.
Defined-instances run from 0 to 3, labelled using Instancing
2.
| Maximum | 5524 |
| Decile 9 | 134 |
| Decile 8 | 104 |
| Decile 7 | 88 |
| Decile 6 | 78 |
| Median | 70 |
| Decile 4 | 64 |
| Decile 3 | 58 |
| Decile 2 | 53 |
| Decile 1 | 47 |
| Minimum | 4 |
|
|
- There are 654 distinct values.
- Mean = 83.5373
- Std.dev = 49.6095
- 5961 items above graph maximum of 221
|
4 Instances
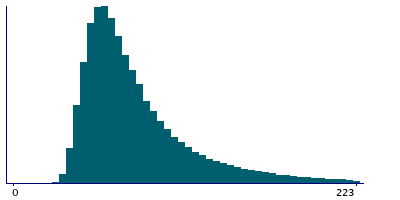
Instance 0 : Initial assessment visit (2006-2010) at which participants were recruited and consent given
164,788 participants, 164,788 items
| Maximum | 3520 |
| Decile 9 | 144 |
| Decile 8 | 110 |
| Decile 7 | 92 |
| Decile 6 | 81 |
| Median | 72 |
| Decile 4 | 65 |
| Decile 3 | 59 |
| Decile 2 | 53 |
| Decile 1 | 47 |
| Minimum | 4 |
|
|
- There are 629 distinct values.
- Mean = 87.4589
- Std.dev = 53.5327
- 3213 items above graph maximum of 241
|
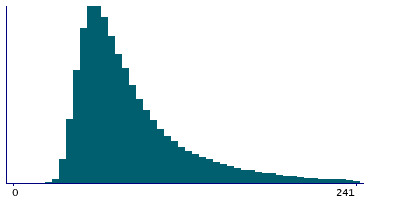
Instance 1 : First repeat assessment visit (2012-13)
20,046 participants, 20,046 items
| Maximum | 1527 |
| Decile 9 | 124 |
| Decile 8 | 97 |
| Decile 7 | 83 |
| Decile 6 | 74 |
| Median | 67 |
| Decile 4 | 61 |
| Decile 3 | 56 |
| Decile 2 | 51 |
| Decile 1 | 46 |
| Minimum | 18 |
|
|
- There are 328 distinct values.
- Mean = 78.5979
- Std.dev = 43.9397
- 376 items above graph maximum of 202
|
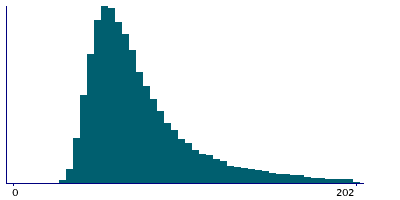
Instance 2 : Imaging visit (2014+)
93,332 participants, 93,332 items
| Maximum | 5524 |
| Decile 9 | 122 |
| Decile 8 | 97 |
| Decile 7 | 84 |
| Decile 6 | 75 |
| Median | 68 |
| Decile 4 | 63 |
| Decile 3 | 58 |
| Decile 2 | 53 |
| Decile 1 | 47 |
| Minimum | 18 |
|
|
- There are 416 distinct values.
- Mean = 79.1608
- Std.dev = 44.9457
- 1779 items above graph maximum of 197
|
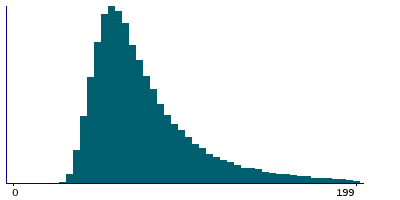
Instance 3 : First repeat imaging visit (2019+)
19,701 participants, 19,701 items
| Maximum | 1172 |
| Decile 9 | 116 |
| Decile 8 | 93 |
| Decile 7 | 81 |
| Decile 6 | 73 |
| Median | 67 |
| Decile 4 | 62 |
| Decile 3 | 57 |
| Decile 2 | 52 |
| Decile 1 | 47 |
| Minimum | 24 |
|
|
- There are 304 distinct values.
- Mean = 76.4953
- Std.dev = 37.5692
- 374 items above graph maximum of 185
|

