Data
813,064 items of data are available, covering 90,855 participants.
Defined-instances run from 0 to 3, labelled using Instancing
2.
Array indices run from 0 to 15.
Units of measurement are milliseconds.
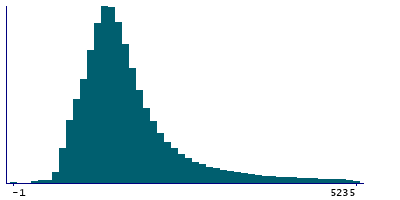
| Maximum | 225483 |
| Decile 9 | 3125 |
| Decile 8 | 2278 |
| Decile 7 | 1938 |
| Decile 6 | 1747 |
| Median | 1594 |
| Decile 4 | 1468 |
| Decile 3 | 1344 |
| Decile 2 | 1203 |
| Decile 1 | 1015 |
| Minimum | -1 |
|
|
- There are 6324 distinct values.
- Mean = 2046.04
- Std.dev = 2402.49
- 28508 items above graph maximum of 5235
|
3 Instances
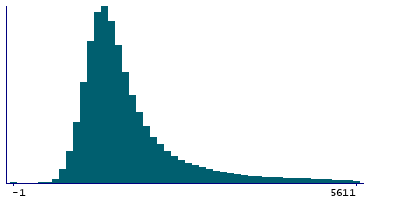
Instance 0 : Initial assessment visit (2006-2010) at which participants were recruited and consent given
51,604 participants, 418,884 items
| Maximum | 197844 |
| Decile 9 | 3391 |
| Decile 8 | 2422 |
| Decile 7 | 2046 |
| Decile 6 | 1813 |
| Median | 1672 |
| Decile 4 | 1547 |
| Decile 3 | 1437 |
| Decile 2 | 1313 |
| Decile 1 | 1171 |
| Minimum | -1 |
|
|
- There are 3566 distinct values.
- Mean = 2204.61
- Std.dev = 2637.26
- 15349 items above graph maximum of 5611
|
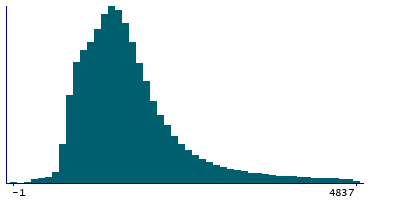
Instance 2 : Imaging visit (2014+)
42,949 participants, 352,422 items
| Maximum | 225483 |
| Decile 9 | 2871 |
| Decile 8 | 2153 |
| Decile 7 | 1856 |
| Decile 6 | 1669 |
| Median | 1513 |
| Decile 4 | 1388 |
| Decile 3 | 1248 |
| Decile 2 | 1092 |
| Decile 1 | 905 |
| Minimum | -1 |
|
|
- There are 3052 distinct values.
- Mean = 1894.91
- Std.dev = 2152.52
- 11704 items above graph maximum of 4837
|
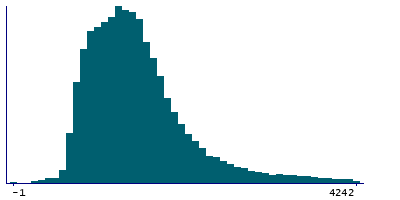
Instance 3 : First repeat imaging visit (2019+)
4,995 participants, 41,758 items
| Maximum | 143583 |
| Decile 9 | 2558 |
| Decile 8 | 1997 |
| Decile 7 | 1747 |
| Decile 6 | 1576 |
| Median | 1451 |
| Decile 4 | 1311 |
| Decile 3 | 1185 |
| Decile 2 | 1030 |
| Decile 1 | 874 |
| Minimum | -1 |
|
|
- There are 1251 distinct values.
- Mean = 1730.93
- Std.dev = 1723.05
- 1350 items above graph maximum of 4242
|
Notes
When the participant touched the first key while entering a remembered number.
0 Related Data-Fields
There are no related data-fields


