Data
7,561,464 items of data are available, covering 496,387 participants.
Defined-instances run from 0 to 3, labelled using Instancing
2.
Array indices run from 0 to 11.
| Maximum | 93 |
| Decile 9 | 1 |
| Decile 8 | 1 |
| Decile 7 | 1 |
| Decile 6 | 1 |
| Median | 1 |
| Decile 4 | 0 |
| Decile 3 | 0 |
| Decile 2 | 0 |
| Decile 1 | 0 |
| Minimum | 0 |
|
|
- There are 72 distinct values.
- Mean = 0.52342
- Std.dev = 0.840276
- 18897 items above graph maximum of 2
|
4 Instances
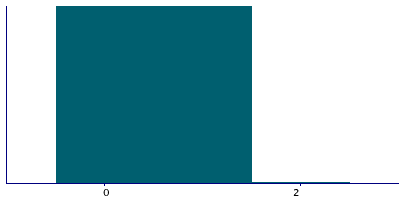
Instance 0 : Initial assessment visit (2006-2010) at which participants were recruited and consent given
495,122 participants, 5,941,464 items
| Maximum | 65 |
| Decile 9 | 1 |
| Decile 8 | 1 |
| Decile 7 | 1 |
| Decile 6 | 1 |
| Median | 1 |
| Decile 4 | 0 |
| Decile 3 | 0 |
| Decile 2 | 0 |
| Decile 1 | 0 |
| Minimum | 0 |
|

|
- There are 62 distinct values.
- Mean = 0.522919
- Std.dev = 0.80446
- 15007 items above graph maximum of 2
|
Instance 1 : First repeat assessment visit (2012-13)
20,309 participants, 243,708 items
| Maximum | 65 |
| Decile 9 | 1 |
| Decile 8 | 1 |
| Decile 7 | 1 |
| Decile 6 | 1 |
| Median | 1 |
| Decile 4 | 0 |
| Decile 3 | 0 |
| Decile 2 | 0 |
| Decile 1 | 0 |
| Minimum | 0 |
|

|
- There are 44 distinct values.
- Mean = 0.523934
- Std.dev = 0.859267
- 527 items above graph maximum of 2
|
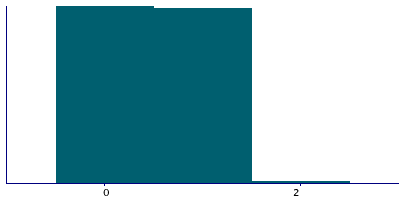
Instance 2 : Imaging visit (2014+)
94,752 participants, 1,137,024 items
| Maximum | 93 |
| Decile 9 | 1 |
| Decile 8 | 1 |
| Decile 7 | 1 |
| Decile 6 | 1 |
| Median | 1 |
| Decile 4 | 0 |
| Decile 3 | 0 |
| Decile 2 | 0 |
| Decile 1 | 0 |
| Minimum | 0 |
|
|
- There are 69 distinct values.
- Mean = 0.52661
- Std.dev = 0.997632
- 2863 items above graph maximum of 2
|
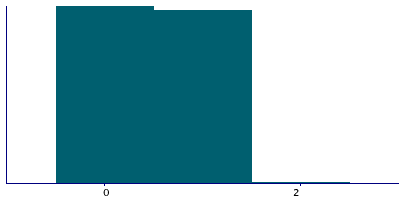
Instance 3 : First repeat imaging visit (2019+)
19,939 participants, 239,268 items
| Maximum | 92 |
| Decile 9 | 1 |
| Decile 8 | 1 |
| Decile 7 | 1 |
| Decile 6 | 1 |
| Median | 1 |
| Decile 4 | 0 |
| Decile 3 | 0 |
| Decile 2 | 0 |
| Decile 1 | 0 |
| Minimum | 0 |
|
|
- There are 45 distinct values.
- Mean = 0.520187
- Std.dev = 0.87268
- 500 items above graph maximum of 2
|


