Data
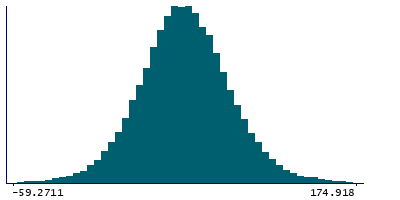
68,032 items of data are available, covering 64,317 participants.
Defined-instances run from 2 to 3, labelled using Instancing
2.
Units of measurement are %.
| Maximum | 402.739 |
| Decile 9 | 97.2141 |
| Decile 8 | 82.5928 |
| Decile 7 | 72.7142 |
| Decile 6 | 64.4661 |
| Median | 56.903 |
| Decile 4 | 49.3957 |
| Decile 3 | 41.3837 |
| Decile 2 | 31.7648 |
| Decile 1 | 17.6728 |
| Minimum | -907.022 |
|

|
- Mean = 57.0292
- Std.dev = 34.1485
- 170 items below graph minimum of -61.8686
- 111 items above graph maximum of 176.756
|
2 Instances
Instance 2 : Imaging visit (2014+)
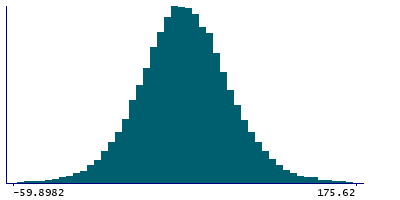
63,838 participants, 63,838 items
| Maximum | 402.739 |
| Decile 9 | 97.4659 |
| Decile 8 | 82.7835 |
| Decile 7 | 72.9067 |
| Decile 6 | 64.6019 |
| Median | 56.9153 |
| Decile 4 | 49.3924 |
| Decile 3 | 41.3063 |
| Decile 2 | 31.6071 |
| Decile 1 | 17.3598 |
| Minimum | -907.022 |
|

|
- Mean = 57.0469
- Std.dev = 34.4092
- 163 items below graph minimum of -62.7462
- 105 items above graph maximum of 177.572
|
Instance 3 : First repeat imaging visit (2019+)
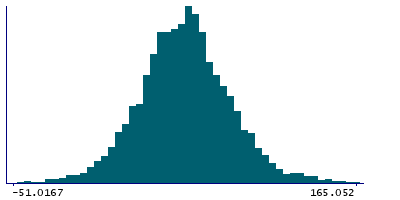
4,194 participants, 4,194 items
| Maximum | 199.115 |
| Decile 9 | 93.0293 |
| Decile 8 | 79.6447 |
| Decile 7 | 69.9081 |
| Decile 6 | 63.0638 |
| Median | 56.8021 |
| Decile 4 | 49.5587 |
| Decile 3 | 42.3461 |
| Decile 2 | 34.0786 |
| Decile 1 | 21.0063 |
| Minimum | -195.359 |
|

|
- Mean = 56.7608
- Std.dev = 29.9
- 8 items below graph minimum of -51.0167
- 9 items above graph maximum of 165.052
|
Notes
Median BOLD effect (in group-defined mask) for faces-shapes contrast (in task fMRI data, using cortical surface analysis)
1 Related Data-Field
| Field ID | Description | Relationship |
|---|
| 25048 | Median BOLD effect (in group-defined ... | Field 25048 is an analogue for Current Field |


