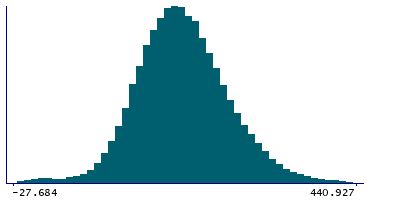
Data
68,033 items of data are available, covering 64,317 participants.
Defined-instances run from 2 to 3, labelled using Instancing
2.
Units of measurement are %.
| Maximum | 1357.72 |
| Decile 9 | 284.368 |
| Decile 8 | 252.468 |
| Decile 7 | 231.651 |
| Decile 6 | 214.82 |
| Median | 199.534 |
| Decile 4 | 184.626 |
| Decile 3 | 169.341 |
| Decile 2 | 151.714 |
| Decile 1 | 127.832 |
| Minimum | -96.6646 |
|
|
- Mean = 202.908
- Std.dev = 64.9872
- 27 items below graph minimum of -28.7052
- 128 items above graph maximum of 440.905
|
2 Instances
Instance 2 : Imaging visit (2014+)
63,839 participants, 63,839 items
| Maximum | 1357.72 |
| Decile 9 | 285.39 |
| Decile 8 | 253.35 |
| Decile 7 | 232.53 |
| Decile 6 | 215.579 |
| Median | 200.177 |
| Decile 4 | 185.303 |
| Decile 3 | 169.854 |
| Decile 2 | 152.131 |
| Decile 1 | 128.022 |
| Minimum | -96.6646 |
|

|
- Mean = 203.582
- Std.dev = 65.2673
- 23 items below graph minimum of -29.347
- 115 items above graph maximum of 442.759
|
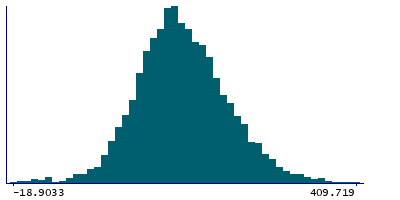
Instance 3 : First repeat imaging visit (2019+)
4,194 participants, 4,194 items
| Maximum | 838.335 |
| Decile 9 | 266.688 |
| Decile 8 | 238.051 |
| Decile 7 | 219.373 |
| Decile 6 | 203.355 |
| Median | 188.7 |
| Decile 4 | 175.932 |
| Decile 3 | 162.28 |
| Decile 2 | 146.627 |
| Decile 1 | 123.971 |
| Minimum | -25.7656 |
|
|
- Mean = 192.653
- Std.dev = 59.6308
- 1 item below graph minimum of -18.7459
- 11 items above graph maximum of 409.404
|
Notes
90th percentile of the BOLD effect (in group-defined mask) for faces activation (in task fMRI data, using cortical surface analysis)
1 Related Data-Field
| Field ID | Description | Relationship |
|---|
| 25763 | 90th percentile of BOLD effect (in g ... | Field 25763 is an analogue for Current Field |


