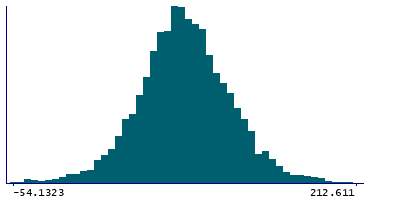
Data
68,033 items of data are available, covering 64,317 participants.
Defined-instances run from 2 to 3, labelled using Instancing
2.
Units of measurement are %.
| Maximum | 559.736 |
| Decile 9 | 126.949 |
| Decile 8 | 110.276 |
| Decile 7 | 98.5897 |
| Decile 6 | 88.9019 |
| Median | 80.0158 |
| Decile 4 | 71.3475 |
| Decile 3 | 61.8107 |
| Decile 2 | 50.5934 |
| Decile 1 | 33.0106 |
| Minimum | -1072.76 |
|

|
- Mean = 79.3494
- Std.dev = 40.5949
- 298 items below graph minimum of -60.9274
- 55 items above graph maximum of 220.887
|
2 Instances
Instance 2 : Imaging visit (2014+)
63,839 participants, 63,839 items
| Maximum | 559.736 |
| Decile 9 | 127.172 |
| Decile 8 | 110.394 |
| Decile 7 | 98.7686 |
| Decile 6 | 89.0612 |
| Median | 80.1666 |
| Decile 4 | 71.4209 |
| Decile 3 | 61.8519 |
| Decile 2 | 50.5515 |
| Decile 1 | 32.8999 |
| Minimum | -1072.76 |
|

|
- Mean = 79.4074
- Std.dev = 40.7879
- 285 items below graph minimum of -61.3723
- 51 items above graph maximum of 221.444
|
Instance 3 : First repeat imaging visit (2019+)
4,194 participants, 4,194 items
| Maximum | 410.762 |
| Decile 9 | 123.549 |
| Decile 8 | 107.652 |
| Decile 7 | 95.5181 |
| Decile 6 | 86.6632 |
| Median | 78.0027 |
| Decile 4 | 70.193 |
| Decile 3 | 61.2945 |
| Decile 2 | 51.1919 |
| Decile 1 | 34.7821 |
| Minimum | -184.353 |
|
|
- Mean = 78.4666
- Std.dev = 37.5238
- 16 items below graph minimum of -53.9845
- 4 items above graph maximum of 212.315
|
Notes
Median BOLD effect (in group-defined mask) for faces activation (in task fMRI data, using cortical surface analysis)
1 Related Data-Field
| Field ID | Description | Relationship |
|---|
| 25044 | Median BOLD effect (in group-defined ... | Field 25044 is an analogue for Current Field |


