Data
68,033 items of data are available, covering 64,317 participants.
Defined-instances run from 2 to 3, labelled using Instancing
2.
Units of measurement are %.
| Maximum | 651.29 |
| Decile 9 | 124.478 |
| Decile 8 | 107.339 |
| Decile 7 | 95.4545 |
| Decile 6 | 85.6209 |
| Median | 76.6399 |
| Decile 4 | 68.0516 |
| Decile 3 | 58.5763 |
| Decile 2 | 47.0267 |
| Decile 1 | 29.9351 |
| Minimum | -702.09 |
|
|
- Mean = 76.4804
- Std.dev = 40.0627
- 224 items below graph minimum of -64.608
- 61 items above graph maximum of 219.021
|
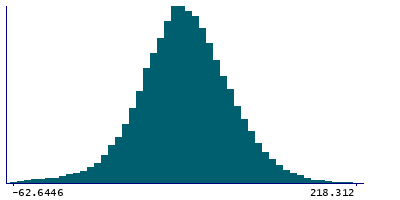
2 Instances
Instance 2 : Imaging visit (2014+)
63,839 participants, 63,839 items
| Maximum | 651.29 |
| Decile 9 | 124.709 |
| Decile 8 | 107.594 |
| Decile 7 | 95.6592 |
| Decile 6 | 85.7856 |
| Median | 76.8255 |
| Decile 4 | 68.1564 |
| Decile 3 | 58.6597 |
| Decile 2 | 47.0773 |
| Decile 1 | 29.9308 |
| Minimum | -702.09 |
|

|
- Mean = 76.6084
- Std.dev = 40.2355
- 210 items below graph minimum of -64.8469
- 58 items above graph maximum of 219.486
|
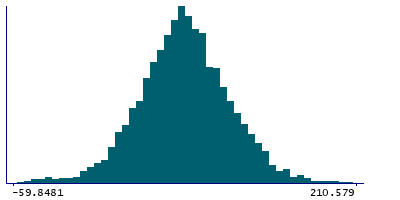
Instance 3 : First repeat imaging visit (2019+)
4,194 participants, 4,194 items
| Maximum | 383.014 |
| Decile 9 | 120.382 |
| Decile 8 | 103.327 |
| Decile 7 | 91.6698 |
| Decile 6 | 82.9742 |
| Median | 74.451 |
| Decile 4 | 66.6305 |
| Decile 3 | 57.5369 |
| Decile 2 | 46.4542 |
| Decile 1 | 30.2942 |
| Minimum | -177.157 |
|
|
- Mean = 74.5324
- Std.dev = 37.2784
- 13 items below graph minimum of -59.7941
- 4 items above graph maximum of 210.471
|
Notes
Median BOLD effect (in group-defined mask) for shapes activation (in task fMRI data, using cortical surface analysis)
1 Related Data-Field
| Field ID | Description | Relationship |
|---|
| 25040 | Median BOLD effect (in group-defined ... | Field 25040 is an analogue for Current Field |


