WARNING: the interactive features of this website use CSS3, which your browser does not support. To use the full features of this website, please update your browser.
Data
330,007 items of data are available, covering 330,007 participants.
Maximum
2020-01-13
Decile 9
2019-07-02
Decile 8
2019-06-30
Decile 7
2019-06-24
Decile 6
2019-06-16
Median
2019-06-13
Decile 4
2019-06-11
Decile 3
2019-06-09
Decile 2
2019-06-06
Decile 1
2019-06-04
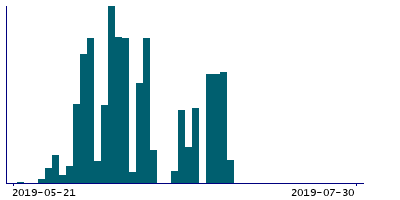
Minimum
2019-05-21
There are 53 distinct values.
Mean = 2019-06-18
4278 items above graph maximum of 2019-07-30
Notes
Dates that invitations to online food preferences questionnaire were emailed to participants.