Data
87,995 items of data are available, covering 83,312 participants.
Defined-instances run from 2 to 3, labelled using Instancing
2.
Units of measurement are mm.
| Maximum | 4.012 |
| Decile 9 | 3.08 |
| Decile 8 | 2.94 |
| Decile 7 | 2.838 |
| Decile 6 | 2.75 |
| Median | 2.668 |
| Decile 4 | 2.587 |
| Decile 3 | 2.498 |
| Decile 2 | 2.395 |
| Decile 1 | 2.254 |
| Minimum | 0 |
|
|
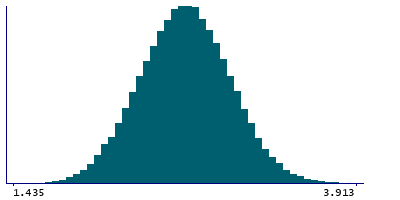
- Mean = 2.66843
- Std.dev = 0.321117
- 3 items below graph minimum of 1.428
- 2 items above graph maximum of 3.906
|
2 Instances
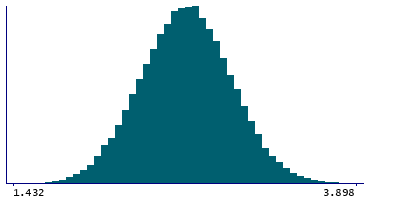
Instance 2 : Imaging visit (2014+)
83,240 participants, 83,240 items
| Maximum | 4.012 |
| Decile 9 | 3.08 |
| Decile 8 | 2.939 |
| Decile 7 | 2.837 |
| Decile 6 | 2.748 |
| Median | 2.667 |
| Decile 4 | 2.586 |
| Decile 3 | 2.497 |
| Decile 2 | 2.393 |
| Decile 1 | 2.252 |
| Minimum | 0 |
|
|
- Mean = 2.66731
- Std.dev = 0.321257
- 3 items below graph minimum of 1.424
- 1 item above graph maximum of 3.908
|
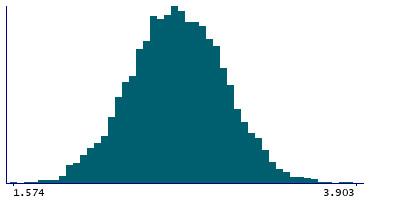
Instance 3 : First repeat imaging visit (2019+)
4,755 participants, 4,755 items
| Maximum | 3.914 |
| Decile 9 | 3.093 |
| Decile 8 | 2.958 |
| Decile 7 | 2.861 |
| Decile 6 | 2.77 |
| Median | 2.687 |
| Decile 4 | 2.603 |
| Decile 3 | 2.5195 |
| Decile 2 | 2.42 |
| Decile 1 | 2.283 |
| Minimum | 1.574 |
|
|
- Mean = 2.68797
- Std.dev = 0.318025
- 1 item above graph maximum of 3.903
|
Notes
Mean thickness of S-temporal-transverse in the right hemisphere generated by parcellation of the white surface using Destrieux (a2009s) parcellation
0 Related Data-Fields
There are no related data-fields
0 Resources
There are no matching Resources
