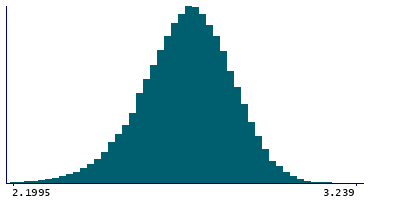
Data
87,996 items of data are available, covering 83,313 participants.
Defined-instances run from 2 to 3, labelled using Instancing
2.
Units of measurement are mm.
| Maximum | 3.345 |
| Decile 9 | 2.889 |
| Decile 8 | 2.833 |
| Decile 7 | 2.793 |
| Decile 6 | 2.758 |
| Median | 2.725 |
| Decile 4 | 2.691 |
| Decile 3 | 2.653 |
| Decile 2 | 2.607 |
| Decile 1 | 2.541 |
| Minimum | 1.605 |
|
|
- Mean = 2.71808
- Std.dev = 0.13835
- 97 items below graph minimum of 2.193
- 5 items above graph maximum of 3.237
|
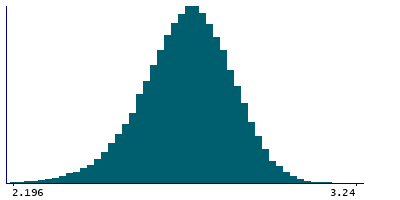
2 Instances
Instance 2 : Imaging visit (2014+)
83,241 participants, 83,241 items
| Maximum | 3.345 |
| Decile 9 | 2.888 |
| Decile 8 | 2.833 |
| Decile 7 | 2.792 |
| Decile 6 | 2.757 |
| Median | 2.724 |
| Decile 4 | 2.69 |
| Decile 3 | 2.652 |
| Decile 2 | 2.606 |
| Decile 1 | 2.539 |
| Minimum | 1.605 |
|
|
- Mean = 2.71723
- Std.dev = 0.138759
- 93 items below graph minimum of 2.19
- 4 items above graph maximum of 3.237
|
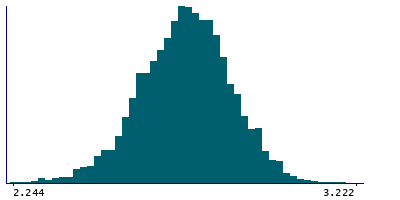
Instance 3 : First repeat imaging visit (2019+)
4,755 participants, 4,755 items
| Maximum | 3.247 |
| Decile 9 | 2.896 |
| Decile 8 | 2.84 |
| Decile 7 | 2.803 |
| Decile 6 | 2.769 |
| Median | 2.737 |
| Decile 4 | 2.707 |
| Decile 3 | 2.669 |
| Decile 2 | 2.626 |
| Decile 1 | 2.57 |
| Minimum | 2.14 |
|
|
- Mean = 2.73302
- Std.dev = 0.130086
- 5 items below graph minimum of 2.244
- 1 item above graph maximum of 3.222
|
Notes
Mean thickness of S-temporal-sup in the right hemisphere generated by parcellation of the white surface using Destrieux (a2009s) parcellation
0 Related Data-Fields
There are no related data-fields
0 Resources
There are no matching Resources
