Data
87,996 items of data are available, covering 83,313 participants.
Defined-instances run from 2 to 3, labelled using Instancing
2.
Units of measurement are mm2.
| Maximum | 598 |
| Decile 9 | 322 |
| Decile 8 | 294 |
| Decile 7 | 276 |
| Decile 6 | 262 |
| Median | 249 |
| Decile 4 | 238 |
| Decile 3 | 226 |
| Decile 2 | 214 |
| Decile 1 | 198 |
| Minimum | 71 |
|

|
- Mean = 255.719
- Std.dev = 50.15
- 243 items above graph maximum of 446
|
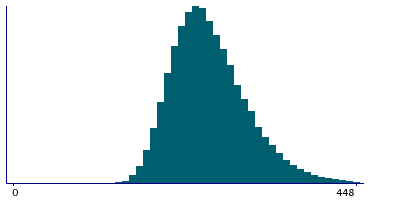
2 Instances
Instance 2 : Imaging visit (2014+)
83,241 participants, 83,241 items
| Maximum | 598 |
| Decile 9 | 322 |
| Decile 8 | 294 |
| Decile 7 | 276 |
| Decile 6 | 261 |
| Median | 249 |
| Decile 4 | 238 |
| Decile 3 | 226 |
| Decile 2 | 213 |
| Decile 1 | 198 |
| Minimum | 71 |
|
|
- Mean = 255.533
- Std.dev = 50.0875
- 226 items above graph maximum of 446
|
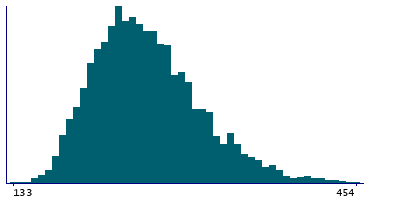
Instance 3 : First repeat imaging visit (2019+)
4,755 participants, 4,755 items
| Maximum | 516 |
| Decile 9 | 327 |
| Decile 8 | 298 |
| Decile 7 | 280 |
| Decile 6 | 265 |
| Median | 253 |
| Decile 4 | 241 |
| Decile 3 | 229 |
| Decile 2 | 216 |
| Decile 1 | 200 |
| Minimum | 133 |
|
|
- Mean = 258.962
- Std.dev = 51.1229
- 13 items above graph maximum of 454
|
Notes
Area of G-temp-sup-G-T-transv in the right hemisphere generated by parcellation of the white surface using Destrieux (a2009s) parcellation
0 Related Data-Fields
There are no related data-fields
0 Resources
There are no matching Resources
