Data
87,996 items of data are available, covering 83,313 participants.
Defined-instances run from 2 to 3, labelled using Instancing
2.
Units of measurement are mm.
| Maximum | 3.384 |
| Decile 9 | 2.809 |
| Decile 8 | 2.756 |
| Decile 7 | 2.716 |
| Decile 6 | 2.682 |
| Median | 2.649 |
| Decile 4 | 2.615 |
| Decile 3 | 2.578 |
| Decile 2 | 2.532 |
| Decile 1 | 2.467 |
| Minimum | 1.734 |
|
|
- Mean = 2.64204
- Std.dev = 0.136489
- 77 items below graph minimum of 2.125
- 2 items above graph maximum of 3.151
|
2 Instances
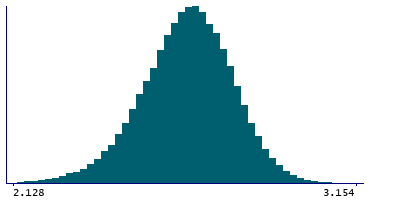
Instance 2 : Imaging visit (2014+)
83,241 participants, 83,241 items
| Maximum | 3.384 |
| Decile 9 | 2.809 |
| Decile 8 | 2.756 |
| Decile 7 | 2.716 |
| Decile 6 | 2.681 |
| Median | 2.648 |
| Decile 4 | 2.615 |
| Decile 3 | 2.577 |
| Decile 2 | 2.531 |
| Decile 1 | 2.466 |
| Minimum | 1.879 |
|

|
- Mean = 2.64154
- Std.dev = 0.136901
- 71 items below graph minimum of 2.123
- 2 items above graph maximum of 3.152
|
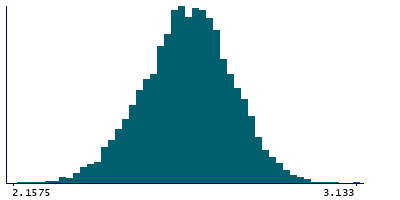
Instance 3 : First repeat imaging visit (2019+)
4,755 participants, 4,755 items
| Maximum | 3.133 |
| Decile 9 | 2.8125 |
| Decile 8 | 2.758 |
| Decile 7 | 2.72 |
| Decile 6 | 2.687 |
| Median | 2.655 |
| Decile 4 | 2.623 |
| Decile 3 | 2.589 |
| Decile 2 | 2.545 |
| Decile 1 | 2.485 |
| Minimum | 1.734 |
|
|
- Mean = 2.65088
- Std.dev = 0.128742
- 5 items below graph minimum of 2.1575
|
Notes
Mean thickness of S-temporal-sup in the left hemisphere generated by parcellation of the white surface using Destrieux (a2009s) parcellation
0 Related Data-Fields
There are no related data-fields
0 Resources
There are no matching Resources
