Data
87,996 items of data are available, covering 83,313 participants.
Defined-instances run from 2 to 3, labelled using Instancing
2.
Units of measurement are mm.
| Maximum | 3.767 |
| Decile 9 | 3.153 |
| Decile 8 | 3.07 |
| Decile 7 | 3.01 |
| Decile 6 | 2.959 |
| Median | 2.911 |
| Decile 4 | 2.863 |
| Decile 3 | 2.809 |
| Decile 2 | 2.746 |
| Decile 1 | 2.655 |
| Minimum | 1.351 |
|
|
- Mean = 2.90661
- Std.dev = 0.196699
- 40 items below graph minimum of 2.157
- 8 items above graph maximum of 3.651
|
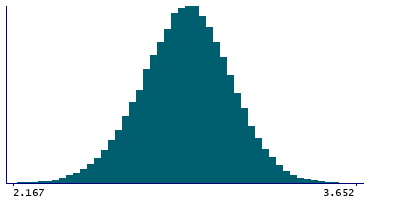
2 Instances
Instance 2 : Imaging visit (2014+)
83,241 participants, 83,241 items
| Maximum | 3.767 |
| Decile 9 | 3.153 |
| Decile 8 | 3.069 |
| Decile 7 | 3.009 |
| Decile 6 | 2.958 |
| Median | 2.911 |
| Decile 4 | 2.863 |
| Decile 3 | 2.809 |
| Decile 2 | 2.745 |
| Decile 1 | 2.654 |
| Minimum | 2.027 |
|

|
- Mean = 2.90594
- Std.dev = 0.196913
- 36 items below graph minimum of 2.155
- 7 items above graph maximum of 3.652
|
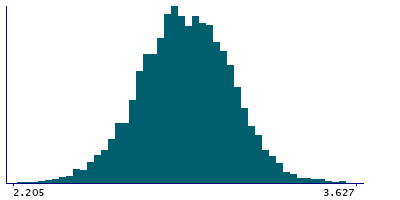
Instance 3 : First repeat imaging visit (2019+)
4,755 participants, 4,755 items
| Maximum | 3.656 |
| Decile 9 | 3.153 |
| Decile 8 | 3.08 |
| Decile 7 | 3.021 |
| Decile 6 | 2.97 |
| Median | 2.919 |
| Decile 4 | 2.87 |
| Decile 3 | 2.82 |
| Decile 2 | 2.757 |
| Decile 1 | 2.679 |
| Minimum | 1.351 |
|
|
- Mean = 2.91821
- Std.dev = 0.192549
- 3 items below graph minimum of 2.205
- 2 items above graph maximum of 3.627
|
Notes
Mean thickness of G+S-subcentral in the left hemisphere generated by parcellation of the white surface using Destrieux (a2009s) parcellation
0 Related Data-Fields
There are no related data-fields
0 Resources
There are no matching Resources
