Data
87,996 items of data are available, covering 83,313 participants.
Defined-instances run from 2 to 3, labelled using Instancing
2.
Units of measurement are mm.
| Maximum | 3.413 |
| Decile 9 | 2.79 |
| Decile 8 | 2.692 |
| Decile 7 | 2.619 |
| Decile 6 | 2.553 |
| Median | 2.49 |
| Decile 4 | 2.425 |
| Decile 3 | 2.353 |
| Decile 2 | 2.268 |
| Decile 1 | 2.143 |
| Minimum | 0.907 |
|
|
- Mean = 2.47637
- Std.dev = 0.252968
- 27 items below graph minimum of 1.496
|
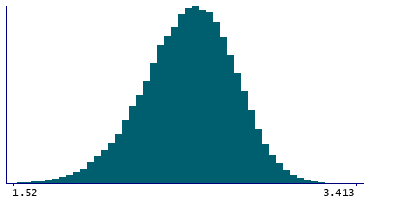
2 Instances
Instance 2 : Imaging visit (2014+)
83,241 participants, 83,241 items
| Maximum | 3.413 |
| Decile 9 | 2.789 |
| Decile 8 | 2.691 |
| Decile 7 | 2.619 |
| Decile 6 | 2.552 |
| Median | 2.489 |
| Decile 4 | 2.424 |
| Decile 3 | 2.352 |
| Decile 2 | 2.267 |
| Decile 1 | 2.142 |
| Minimum | 1.354 |
|

|
- Mean = 2.47545
- Std.dev = 0.253049
- 25 items below graph minimum of 1.495
|
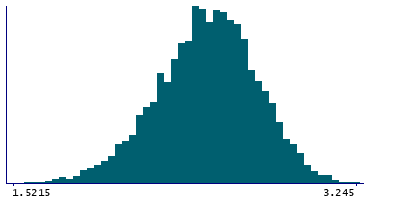
Instance 3 : First repeat imaging visit (2019+)
4,755 participants, 4,755 items
| Maximum | 3.245 |
| Decile 9 | 2.8055 |
| Decile 8 | 2.7 |
| Decile 7 | 2.631 |
| Decile 6 | 2.567 |
| Median | 2.503 |
| Decile 4 | 2.442 |
| Decile 3 | 2.372 |
| Decile 2 | 2.285 |
| Decile 1 | 2.164 |
| Minimum | 0.907 |
|
|
- Mean = 2.49233
- Std.dev = 0.251015
- 2 items below graph minimum of 1.5225
|
Notes
Mean thickness of G+S-paracentral in the left hemisphere generated by parcellation of the white surface using Destrieux (a2009s) parcellation
0 Related Data-Fields
There are no related data-fields
0 Resources
There are no matching Resources
