Data
87,936 items of data are available, covering 83,259 participants.
Defined-instances run from 2 to 3, labelled using Instancing
2.
Units of measurement are mm2.
| Maximum | 899 |
| Decile 9 | 390 |
| Decile 8 | 323 |
| Decile 7 | 279 |
| Decile 6 | 243 |
| Median | 213 |
| Decile 4 | 187 |
| Decile 3 | 161 |
| Decile 2 | 134 |
| Decile 1 | 102 |
| Minimum | 0 |
|

|
- Mean = 232.008
- Std.dev = 113.484
- 73 items above graph maximum of 678
|
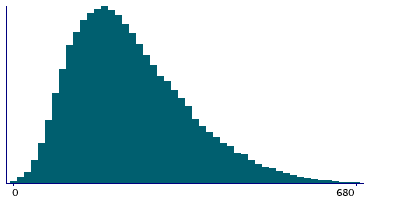
2 Instances
Instance 2 : Imaging visit (2014+)
83,188 participants, 83,188 items
| Maximum | 899 |
| Decile 9 | 389 |
| Decile 8 | 323 |
| Decile 7 | 279 |
| Decile 6 | 243 |
| Median | 213 |
| Decile 4 | 187 |
| Decile 3 | 161 |
| Decile 2 | 134 |
| Decile 1 | 102 |
| Minimum | 0 |
|
|
- Mean = 231.92
- Std.dev = 113.438
- 75 items above graph maximum of 676
|
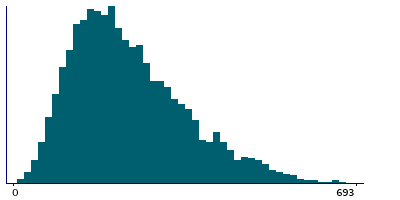
Instance 3 : First repeat imaging visit (2019+)
4,748 participants, 4,748 items
| Maximum | 714 |
| Decile 9 | 398 |
| Decile 8 | 327 |
| Decile 7 | 280 |
| Decile 6 | 245 |
| Median | 215 |
| Decile 4 | 187 |
| Decile 3 | 161 |
| Decile 2 | 134 |
| Decile 1 | 103 |
| Minimum | 14 |
|
|
- Mean = 233.547
- Std.dev = 114.276
- 2 items above graph maximum of 693
|
Notes
Area of S-interm-prim-Jensen in the left hemisphere generated by parcellation of the white surface using Destrieux (a2009s) parcellation
0 Related Data-Fields
There are no related data-fields
0 Resources
There are no matching Resources
