Data
87,996 items of data are available, covering 83,313 participants.
Defined-instances run from 2 to 3, labelled using Instancing
2.
Units of measurement are mm3.
| Maximum | 2109 |
| Decile 9 | 1203 |
| Decile 8 | 1112 |
| Decile 7 | 1051 |
| Decile 6 | 1002 |
| Median | 959 |
| Decile 4 | 917 |
| Decile 3 | 876 |
| Decile 2 | 829 |
| Decile 1 | 770 |
| Minimum | 154 |
|

|
- Mean = 975.022
- Std.dev = 172.223
- 117 items above graph maximum of 1636
|
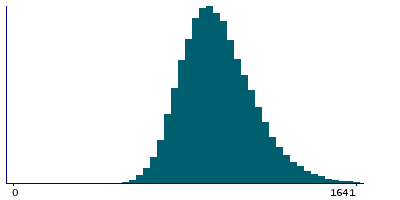
2 Instances
Instance 2 : Imaging visit (2014+)
83,241 participants, 83,241 items
| Maximum | 2109 |
| Decile 9 | 1202 |
| Decile 8 | 1112 |
| Decile 7 | 1050 |
| Decile 6 | 1001 |
| Median | 958 |
| Decile 4 | 917 |
| Decile 3 | 875 |
| Decile 2 | 829 |
| Decile 1 | 769 |
| Minimum | 154 |
|
|
- Mean = 974.509
- Std.dev = 172.166
- 107 items above graph maximum of 1635
|
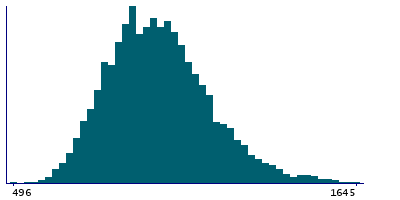
Instance 3 : First repeat imaging visit (2019+)
4,755 participants, 4,755 items
| Maximum | 1825 |
| Decile 9 | 1211 |
| Decile 8 | 1119 |
| Decile 7 | 1059 |
| Decile 6 | 1014 |
| Median | 970 |
| Decile 4 | 926 |
| Decile 3 | 884 |
| Decile 2 | 838 |
| Decile 1 | 777 |
| Minimum | 496 |
|
|
- Mean = 984.009
- Std.dev = 172.976
- 9 items above graph maximum of 1645
|
Notes
Volume of transversetemporal in the right hemisphere generated by parcellation of the white surface using DKT parcellation
0 Related Data-Fields
There are no related data-fields
0 Resources
There are no matching Resources
