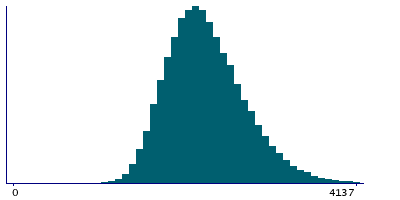
Data
87,996 items of data are available, covering 83,313 participants.
Defined-instances run from 2 to 3, labelled using Instancing
2.
Units of measurement are mm3.
| Maximum | 5859 |
| Decile 9 | 2940.5 |
| Decile 8 | 2691 |
| Decile 7 | 2524 |
| Decile 6 | 2387 |
| Median | 2269 |
| Decile 4 | 2158 |
| Decile 3 | 2045 |
| Decile 2 | 1919 |
| Decile 1 | 1757 |
| Minimum | 815 |
|
|
- Mean = 2317.34
- Std.dev = 467.92
- 79 items above graph maximum of 4124
|
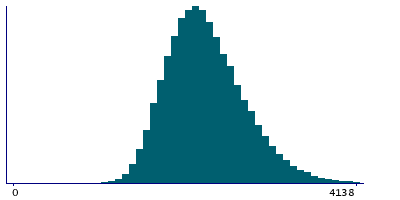
2 Instances
Instance 2 : Imaging visit (2014+)
83,241 participants, 83,241 items
| Maximum | 5859 |
| Decile 9 | 2940 |
| Decile 8 | 2691 |
| Decile 7 | 2522 |
| Decile 6 | 2386 |
| Median | 2267 |
| Decile 4 | 2157 |
| Decile 3 | 2044 |
| Decile 2 | 1918 |
| Decile 1 | 1756 |
| Minimum | 815 |
|
|
- Mean = 2316.3
- Std.dev = 467.915
- 77 items above graph maximum of 4124
|
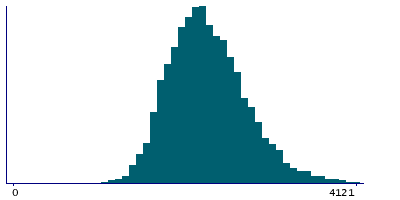
Instance 3 : First repeat imaging visit (2019+)
4,755 participants, 4,755 items
| Maximum | 4733 |
| Decile 9 | 2948 |
| Decile 8 | 2700 |
| Decile 7 | 2546.5 |
| Decile 6 | 2411 |
| Median | 2291 |
| Decile 4 | 2182 |
| Decile 3 | 2066.5 |
| Decile 2 | 1936 |
| Decile 1 | 1775 |
| Minimum | 931 |
|
|
- Mean = 2335.43
- Std.dev = 467.625
- 2 items above graph maximum of 4121
|
Notes
Volume of pericalcarine in the right hemisphere generated by parcellation of the white surface using DKT parcellation
0 Related Data-Fields
There are no related data-fields
0 Resources
There are no matching Resources
