Data
87,996 items of data are available, covering 83,313 participants.
Defined-instances run from 2 to 3, labelled using Instancing
2.
Units of measurement are mm3.
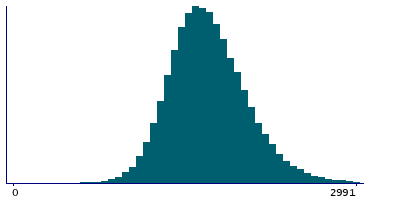
| Maximum | 4235 |
| Decile 9 | 2135 |
| Decile 8 | 1959 |
| Decile 7 | 1842 |
| Decile 6 | 1748 |
| Median | 1665 |
| Decile 4 | 1585 |
| Decile 3 | 1503 |
| Decile 2 | 1411 |
| Decile 1 | 1286 |
| Minimum | 144 |
|
|
- Mean = 1692.77
- Std.dev = 347.238
- 243 items above graph maximum of 2984
|
2 Instances
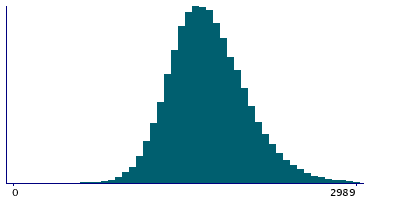
Instance 2 : Imaging visit (2014+)
83,241 participants, 83,241 items
| Maximum | 4235 |
| Decile 9 | 2134 |
| Decile 8 | 1959 |
| Decile 7 | 1842 |
| Decile 6 | 1748 |
| Median | 1665 |
| Decile 4 | 1584 |
| Decile 3 | 1502 |
| Decile 2 | 1410 |
| Decile 1 | 1284 |
| Minimum | 144 |
|
|
- Mean = 1691.97
- Std.dev = 347.198
- 226 items above graph maximum of 2984
|
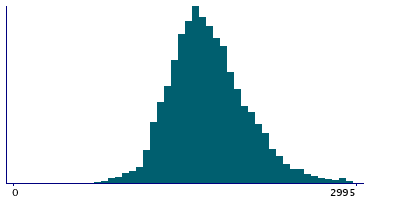
Instance 3 : First repeat imaging visit (2019+)
4,755 participants, 4,755 items
| Maximum | 3781 |
| Decile 9 | 2150 |
| Decile 8 | 1970 |
| Decile 7 | 1847 |
| Decile 6 | 1753 |
| Median | 1670.5 |
| Decile 4 | 1593 |
| Decile 3 | 1517.5 |
| Decile 2 | 1430 |
| Decile 1 | 1305 |
| Minimum | 261 |
|
|
- Mean = 1706.73
- Std.dev = 347.655
- 17 items above graph maximum of 2995
|
Notes
Volume of entorhinal in the right hemisphere generated by parcellation of the white surface using DKT parcellation
0 Related Data-Fields
There are no related data-fields
0 Resources
There are no matching Resources
