Data
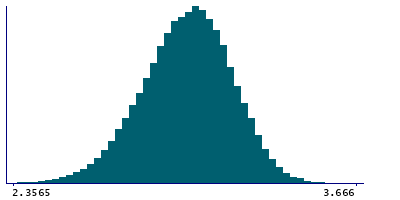
87,996 items of data are available, covering 83,313 participants.
Defined-instances run from 2 to 3, labelled using Instancing
2.
Units of measurement are mm.
| Maximum | 3.721 |
| Decile 9 | 3.223 |
| Decile 8 | 3.155 |
| Decile 7 | 3.105 |
| Decile 6 | 3.061 |
| Median | 3.017 |
| Decile 4 | 2.973 |
| Decile 3 | 2.924 |
| Decile 2 | 2.865 |
| Decile 1 | 2.782 |
| Minimum | 1.644 |
|

|
- Mean = 3.00854
- Std.dev = 0.173461
- 56 items below graph minimum of 2.341
- 2 items above graph maximum of 3.664
|
2 Instances
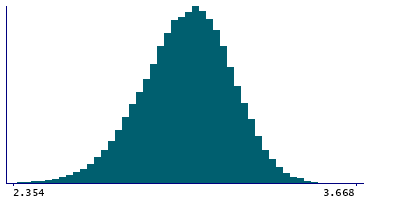
Instance 2 : Imaging visit (2014+)
83,241 participants, 83,241 items
| Maximum | 3.721 |
| Decile 9 | 3.223 |
| Decile 8 | 3.155 |
| Decile 7 | 3.104 |
| Decile 6 | 3.06 |
| Median | 3.016 |
| Decile 4 | 2.972 |
| Decile 3 | 2.923 |
| Decile 2 | 2.864 |
| Decile 1 | 2.78 |
| Minimum | 1.644 |
|

|
- Mean = 3.00755
- Std.dev = 0.173913
- 50 items below graph minimum of 2.337
- 1 item above graph maximum of 3.666
|
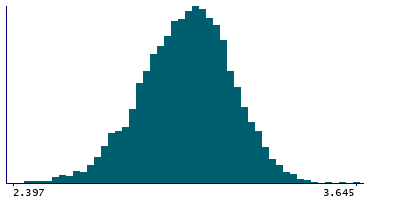
Instance 3 : First repeat imaging visit (2019+)
4,755 participants, 4,755 items
| Maximum | 3.718 |
| Decile 9 | 3.229 |
| Decile 8 | 3.162 |
| Decile 7 | 3.116 |
| Decile 6 | 3.075 |
| Median | 3.034 |
| Decile 4 | 2.991 |
| Decile 3 | 2.945 |
| Decile 2 | 2.89 |
| Decile 1 | 2.813 |
| Minimum | 2.135 |
|

|
- Mean = 3.02595
- Std.dev = 0.164378
- 2 items below graph minimum of 2.397
- 1 item above graph maximum of 3.645
|
Notes
Mean thickness of superiortemporal in the right hemisphere generated by parcellation of the white surface using DKT parcellation
0 Related Data-Fields
There are no related data-fields
0 Resources
There are no matching Resources


