Data
87,996 items of data are available, covering 83,313 participants.
Defined-instances run from 2 to 3, labelled using Instancing
2.
Units of measurement are mm.
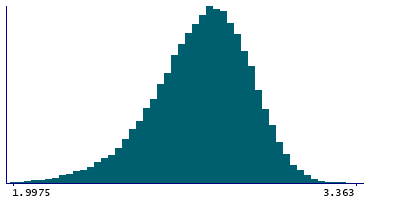
| Maximum | 3.38 |
| Decile 9 | 2.97 |
| Decile 8 | 2.9 |
| Decile 7 | 2.846 |
| Decile 6 | 2.799 |
| Median | 2.752 |
| Decile 4 | 2.702 |
| Decile 3 | 2.646 |
| Decile 2 | 2.577 |
| Decile 1 | 2.471 |
| Minimum | 1.584 |
|
|
- Mean = 2.73304
- Std.dev = 0.198631
- 91 items below graph minimum of 1.972
|
2 Instances
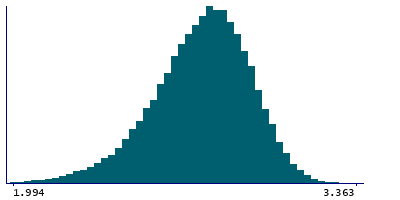
Instance 2 : Imaging visit (2014+)
83,241 participants, 83,241 items
| Maximum | 3.38 |
| Decile 9 | 2.969 |
| Decile 8 | 2.899 |
| Decile 7 | 2.845 |
| Decile 6 | 2.798 |
| Median | 2.751 |
| Decile 4 | 2.7 |
| Decile 3 | 2.644 |
| Decile 2 | 2.575 |
| Decile 1 | 2.469 |
| Minimum | 1.584 |
|
|
- Mean = 2.73161
- Std.dev = 0.199155
- 84 items below graph minimum of 1.969
|
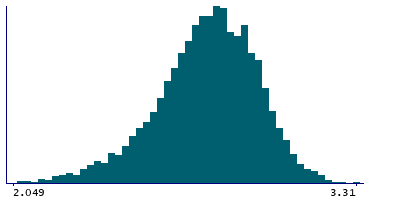
Instance 3 : First repeat imaging visit (2019+)
4,755 participants, 4,755 items
| Maximum | 3.31 |
| Decile 9 | 2.978 |
| Decile 8 | 2.914 |
| Decile 7 | 2.8655 |
| Decile 6 | 2.818 |
| Median | 2.775 |
| Decile 4 | 2.73 |
| Decile 3 | 2.678 |
| Decile 2 | 2.615 |
| Decile 1 | 2.5135 |
| Minimum | 1.65 |
|
|
- Mean = 2.75808
- Std.dev = 0.187459
- 8 items below graph minimum of 2.049
|
Notes
Mean thickness of precentral in the right hemisphere generated by parcellation of the white surface using DKT parcellation
0 Related Data-Fields
There are no related data-fields
0 Resources
There are no matching Resources
