Data
87,996 items of data are available, covering 83,313 participants.
Defined-instances run from 2 to 3, labelled using Instancing
2.
Units of measurement are mm.
| Maximum | 3.554 |
| Decile 9 | 2.899 |
| Decile 8 | 2.817 |
| Decile 7 | 2.759 |
| Decile 6 | 2.71 |
| Median | 2.663 |
| Decile 4 | 2.616 |
| Decile 3 | 2.566 |
| Decile 2 | 2.505 |
| Decile 1 | 2.418 |
| Minimum | 0.981 |
|

|
- Mean = 2.65938
- Std.dev = 0.191188
- 126 items below graph minimum of 1.937
- 4 items above graph maximum of 3.38
|
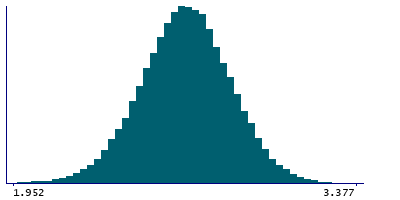
2 Instances
Instance 2 : Imaging visit (2014+)
83,241 participants, 83,241 items
| Maximum | 3.554 |
| Decile 9 | 2.898 |
| Decile 8 | 2.817 |
| Decile 7 | 2.758 |
| Decile 6 | 2.709 |
| Median | 2.662 |
| Decile 4 | 2.616 |
| Decile 3 | 2.565 |
| Decile 2 | 2.504 |
| Decile 1 | 2.417 |
| Minimum | 0.981 |
|
|
- Mean = 2.65866
- Std.dev = 0.191532
- 121 items below graph minimum of 1.936
- 4 items above graph maximum of 3.379
|
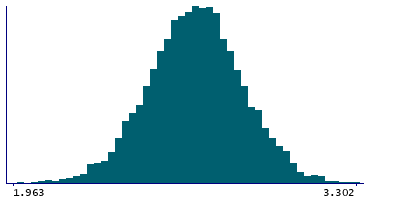
Instance 3 : First repeat imaging visit (2019+)
4,755 participants, 4,755 items
| Maximum | 3.302 |
| Decile 9 | 2.909 |
| Decile 8 | 2.824 |
| Decile 7 | 2.766 |
| Decile 6 | 2.72 |
| Median | 2.675 |
| Decile 4 | 2.628 |
| Decile 3 | 2.58 |
| Decile 2 | 2.522 |
| Decile 1 | 2.436 |
| Minimum | 1.742 |
|
|
- Mean = 2.67195
- Std.dev = 0.184599
- 5 items below graph minimum of 1.963
|
Notes
Mean thickness of posteriorcingulate in the right hemisphere generated by parcellation of the white surface using DKT parcellation
0 Related Data-Fields
There are no related data-fields
0 Resources
There are no matching Resources
