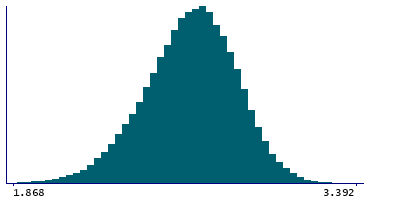
Data
87,996 items of data are available, covering 83,313 participants.
Defined-instances run from 2 to 3, labelled using Instancing
2.
Units of measurement are mm.
| Maximum | 3.458 |
| Decile 9 | 2.897 |
| Decile 8 | 2.819 |
| Decile 7 | 2.759 |
| Decile 6 | 2.707 |
| Median | 2.657 |
| Decile 4 | 2.605 |
| Decile 3 | 2.548 |
| Decile 2 | 2.477 |
| Decile 1 | 2.373 |
| Minimum | 1.59 |
|
|
- Mean = 2.64478
- Std.dev = 0.205215
- 46 items below graph minimum of 1.849
- 1 item above graph maximum of 3.421
|
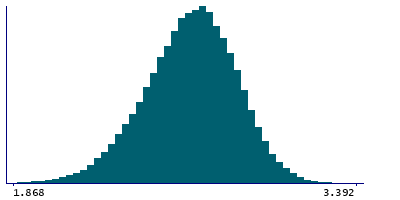
2 Instances
Instance 2 : Imaging visit (2014+)
83,241 participants, 83,241 items
| Maximum | 3.458 |
| Decile 9 | 2.896 |
| Decile 8 | 2.818 |
| Decile 7 | 2.758 |
| Decile 6 | 2.707 |
| Median | 2.656 |
| Decile 4 | 2.604 |
| Decile 3 | 2.547 |
| Decile 2 | 2.476 |
| Decile 1 | 2.372 |
| Minimum | 1.59 |
|
|
- Mean = 2.64411
- Std.dev = 0.20554
- 41 items below graph minimum of 1.848
- 1 item above graph maximum of 3.42
|
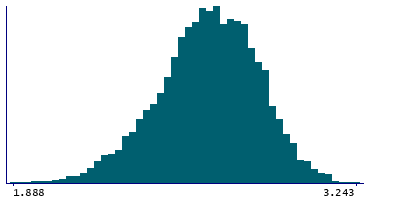
Instance 3 : First repeat imaging visit (2019+)
4,755 participants, 4,755 items
| Maximum | 3.243 |
| Decile 9 | 2.897 |
| Decile 8 | 2.826 |
| Decile 7 | 2.77 |
| Decile 6 | 2.716 |
| Median | 2.667 |
| Decile 4 | 2.617 |
| Decile 3 | 2.564 |
| Decile 2 | 2.497 |
| Decile 1 | 2.3925 |
| Minimum | 1.765 |
|
|
- Mean = 2.65641
- Std.dev = 0.199095
- 5 items below graph minimum of 1.888
|
Notes
Mean thickness of paracentral in the right hemisphere generated by parcellation of the white surface using DKT parcellation
0 Related Data-Fields
There are no related data-fields
0 Resources
There are no matching Resources
