Data
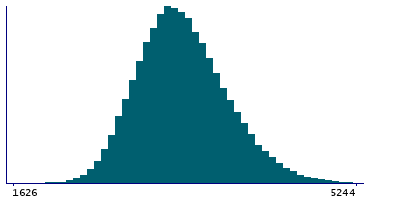
87,996 items of data are available, covering 83,313 participants.
Defined-instances run from 2 to 3, labelled using Instancing
2.
Units of measurement are mm2.
| Maximum | 6343 |
| Decile 9 | 4026 |
| Decile 8 | 3784 |
| Decile 7 | 3620 |
| Decile 6 | 3486 |
| Median | 3365 |
| Decile 4 | 3251 |
| Decile 3 | 3134 |
| Decile 2 | 3001 |
| Decile 1 | 2824 |
| Minimum | 1299 |
|
|
- Mean = 3401.39
- Std.dev = 473.949
- 2 items below graph minimum of 1622
- 70 items above graph maximum of 5228
|
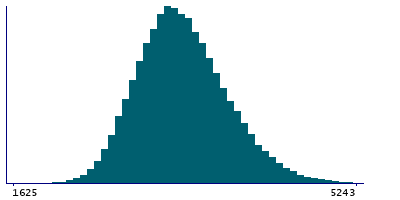
2 Instances
Instance 2 : Imaging visit (2014+)
83,241 participants, 83,241 items
| Maximum | 6343 |
| Decile 9 | 4024 |
| Decile 8 | 3783 |
| Decile 7 | 3619 |
| Decile 6 | 3485 |
| Median | 3364 |
| Decile 4 | 3250 |
| Decile 3 | 3133 |
| Decile 2 | 3000 |
| Decile 1 | 2822 |
| Minimum | 1299 |
|
|
- Mean = 3400.1
- Std.dev = 473.925
- 2 items below graph minimum of 1620
- 65 items above graph maximum of 5226
|
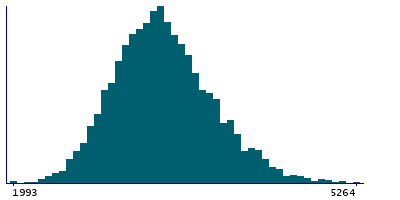
Instance 3 : First repeat imaging visit (2019+)
4,755 participants, 4,755 items
| Maximum | 5868 |
| Decile 9 | 4056 |
| Decile 8 | 3808 |
| Decile 7 | 3640.5 |
| Decile 6 | 3504 |
| Median | 3388 |
| Decile 4 | 3281 |
| Decile 3 | 3158 |
| Decile 2 | 3025 |
| Decile 1 | 2848 |
| Minimum | 1993 |
|
|
- Mean = 3423.9
- Std.dev = 473.808
- 4 items above graph maximum of 5264
|
Notes
Area of supramarginal in the right hemisphere generated by parcellation of the white surface using DKT parcellation
0 Related Data-Fields
There are no related data-fields
0 Resources
There are no matching Resources
