Data
87,996 items of data are available, covering 83,313 participants.
Defined-instances run from 2 to 3, labelled using Instancing
2.
Units of measurement are mm2.
| Maximum | 7446 |
| Decile 9 | 5303 |
| Decile 8 | 5070 |
| Decile 7 | 4910 |
| Decile 6 | 4780 |
| Median | 4662 |
| Decile 4 | 4545 |
| Decile 3 | 4427 |
| Decile 2 | 4296.5 |
| Decile 1 | 4116 |
| Minimum | 2607 |
|

|
- Mean = 4690.68
- Std.dev = 466.621
- 1 item below graph minimum of 2929
- 57 items above graph maximum of 6490
|
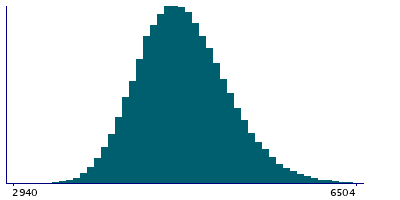
2 Instances
Instance 2 : Imaging visit (2014+)
83,241 participants, 83,241 items
| Maximum | 7446 |
| Decile 9 | 5301 |
| Decile 8 | 5068 |
| Decile 7 | 4909 |
| Decile 6 | 4779 |
| Median | 4661.5 |
| Decile 4 | 4544 |
| Decile 3 | 4426 |
| Decile 2 | 4295 |
| Decile 1 | 4114 |
| Minimum | 2607 |
|
|
- Mean = 4689.38
- Std.dev = 466.743
- 1 item below graph minimum of 2927
- 54 items above graph maximum of 6488
|
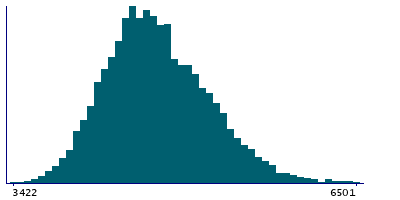
Instance 3 : First repeat imaging visit (2019+)
4,755 participants, 4,755 items
| Maximum | 6801 |
| Decile 9 | 5326.5 |
| Decile 8 | 5100 |
| Decile 7 | 4933 |
| Decile 6 | 4790 |
| Median | 4671 |
| Decile 4 | 4557 |
| Decile 3 | 4447 |
| Decile 2 | 4323 |
| Decile 1 | 4152 |
| Minimum | 3422 |
|
|
- Mean = 4713.53
- Std.dev = 463.89
- 2 items above graph maximum of 6501
|
Notes
Area of superiortemporal in the right hemisphere generated by parcellation of the white surface using DKT parcellation
0 Related Data-Fields
There are no related data-fields
0 Resources
There are no matching Resources
