Data
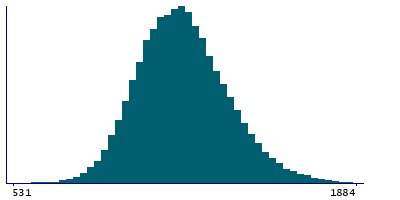
87,996 items of data are available, covering 83,313 participants.
Defined-instances run from 2 to 3, labelled using Instancing
2.
Units of measurement are mm2.
| Maximum | 5537 |
| Decile 9 | 1430 |
| Decile 8 | 1340 |
| Decile 7 | 1278 |
| Decile 6 | 1228 |
| Median | 1184 |
| Decile 4 | 1140 |
| Decile 3 | 1095 |
| Decile 2 | 1045 |
| Decile 1 | 977 |
| Minimum | 399 |
|
|
- Mean = 1195.25
- Std.dev = 181.442
- 8 items below graph minimum of 524
- 94 items above graph maximum of 1883
|
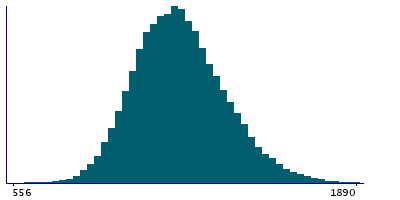
2 Instances
Instance 2 : Imaging visit (2014+)
83,241 participants, 83,241 items
| Maximum | 5537 |
| Decile 9 | 1429 |
| Decile 8 | 1340 |
| Decile 7 | 1278 |
| Decile 6 | 1228 |
| Median | 1184 |
| Decile 4 | 1140 |
| Decile 3 | 1094 |
| Decile 2 | 1044 |
| Decile 1 | 977 |
| Minimum | 399 |
|
|
- Mean = 1194.59
- Std.dev = 181.471
- 8 items below graph minimum of 525
- 90 items above graph maximum of 1881
|
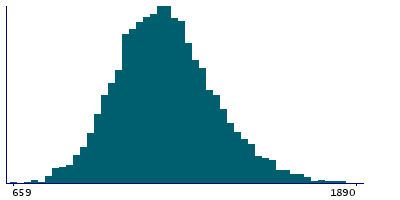
Instance 3 : First repeat imaging visit (2019+)
4,755 participants, 4,755 items
| Maximum | 3122 |
| Decile 9 | 1439.5 |
| Decile 8 | 1347 |
| Decile 7 | 1286 |
| Decile 6 | 1239 |
| Median | 1195.5 |
| Decile 4 | 1152 |
| Decile 3 | 1107 |
| Decile 2 | 1058 |
| Decile 1 | 990 |
| Minimum | 659 |
|
|
- Mean = 1206.65
- Std.dev = 180.546
- 7 items above graph maximum of 1889
|
Notes
Area of posteriorcingulate in the right hemisphere generated by parcellation of the white surface using DKT parcellation
0 Related Data-Fields
There are no related data-fields
0 Resources
There are no matching Resources
